
By Roger J Kerr
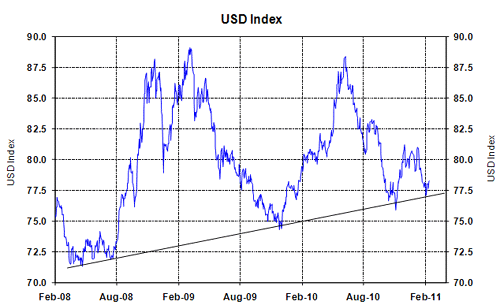
The overall value of the US dollar against all currencies is measured by the USD Index. Since the credit crunch hit the markets in 2008 the USD has experienced two up moves and two down moves, as the charts below confirms.
UP:
Initial USD strength in 2008 as global investment funds rushed to the safe and security of the greenback when the sub-prime mortgage debacle was in full swing (USD Index up from 72 to 88).
DOWN:
USD weakness during 2009 when the Fed slashed US interest rates and Lehman’s fell over (USD Index reversing to 75).
UP:
USD strength through the first half of 2010 as the European sovereign debt crisis (Greece) forced disinvestment out of the Euro back into the USD’s (USD Index up from 75 to 88).
DOWN:
Poor US economic data through the middle part of 2010 culminating in the Fed’s “Quantitative Easing 2” – printing USD’s, thus increasing the supply. The USD was sold down on the expectation ahead of that monetary easing (US Index back down to 76).
The next USD movement
Each low-point in the USD Index has been higher than the previous low since 2008.
The up-trend support line has held firm at 76 over recent weeks and the USD looks destined to move higher on the back of stronger US economic figures.

--------------------
* Roger J Kerr runs Asia Pacific Risk Management. He specialises in fixed interest securities and is a commentator on economics and markets. More commentary and useful information on fixed interest investing can be found at rogeradvice.com
No chart with that title exists.

We welcome your comments below. If you are not already registered, please register to comment
Remember we welcome robust, respectful and insightful debate. We don't welcome abusive or defamatory comments and will de-register those repeatedly making such comments. Our current comment policy is here.