
Today's Top 10 is from Nick Tuffley, Chief Economist at ASB, taking a close and very 'neutral' look at interest rates and various other matters, including why being green is not quite in the bag.
As always, we welcome your additions in the comments below or via email to david.chaston@interest.co.nz.
We are keen to find some new Top 10 contributors so if you're interested in contributing, contact gareth.vaughan@interest.co.nz.
1. The neutral interest rate limbo dance competition is 25 years strong.
Interest rates have been noticeably lower since the Global Financial Crisis. But a working paper from the Federal Reserve Bank of San Francisco (“Measuring the Natural Rate of Interest: International Trends and Determinants”) concludes that the natural (or neutral or equilibrium) interest rate has been in decline for a much longer period in the US, Euro Area, UK and Canada. The findings also suggest global factors have played a role:
We find that large declines in trend GDP growth and natural rates of interest have occurred over the past 25 years in all four economies. These country-by-country estimates are found to display a substantial amount of co-movement over time, suggesting an important role for global factors in shaping trend growth and natural rates of interest.
Think of the neutral/natural/equilibrium interest rate as the Goldilocks interest rate: not too hot and not too cold for the economy. It is an important concept in helping guide both monetary policy settings and to where benchmark investment rates of return are likely to sit in the long term. Unfortunately, the extent of economic change globally over the past decade makes observing this unobservable variable even more challenging.
Image source: Tradecharting
2. Interest rates are low within NZ’s relatively short data history.
The RBNZ provides a long-term history of NZ interest rates, available amongst its growing array of available financial statistics. The past 30 years’ trend decline in various NZ interest rates broadly matches up with the San Francisco Fed’s findings in the above paper.
For many of us in NZ with long memories, the current level of interest rates seem low. NZ had very high interest rates in the 1980s compared with other developed economies, courtesy of our more rampant inflation experience of the time. I have fond memories of earning upwards of 20% interest on term deposits from the proceeds of my milk round job, though less fond memories of how fast the price of my obligatory bottle of Coke went up. And back then I wasn’t calculating what my real after tax return was – or I might have simply spent all my money on Coke.
But those with even longer memories will have a bit more perspective. The post-GFC interest rate environment is more akin to the 1960s period, which pre-dates the period of high inflation and then the 1990s bedding-in of low inflation.
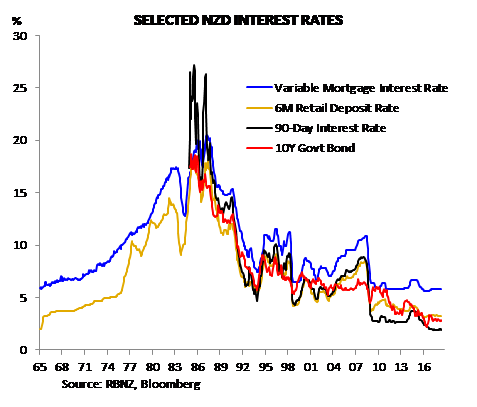
Chart Source: ASB
3. Global history tells us that low – not high – interest rates are more normal.
Bank of England Chief Economist Andy Haldane went back in time (figuratively speaking) in his 2015 speech “Growing, fast and slow”. Although the speech might seemed a little dated, ancient history hasn’t changed over the past three years – and the speech has some fascinating insights into human progress over the last few millennia.
Focusing narrowly on interest rates in the speech:
Interest rates proxy society’s willingness to save or stick. The less willing they are to do so – the greater their impatience - the higher the compensation they require….
Chart 12 plots a measure of short and long-term interest rates back to 3000 BC. Though the data are patchy, they suggest interest rates fell secularly in the run-up to the Industrial Revolution…. One interpretation of these trends is that they reflect society’s evolving time preferences. In the run-up to the Industrial Revolution, society became more willing to wait than in the past. That, in turn, enabled saving, investment and ultimately growth.
There are two things that stand out in the chart (below) from the speech. One is, the 1970s-1980s period of high interest rates was unusual – you have to go back to Babylonian times for equivalent rates. The second is that the recent period of low interest rates is low by the standards of the past 5,000 years.
As an aside, the speech’s historical insights into human progress are well worth reading thoroughly. And for those who prefer pictures, the many charts in the appendix (from Page 25) give an easy overview of per-capita GDP over 3 millennia, various long-term measures of socio-economic progress – and skeletons – amongst others.
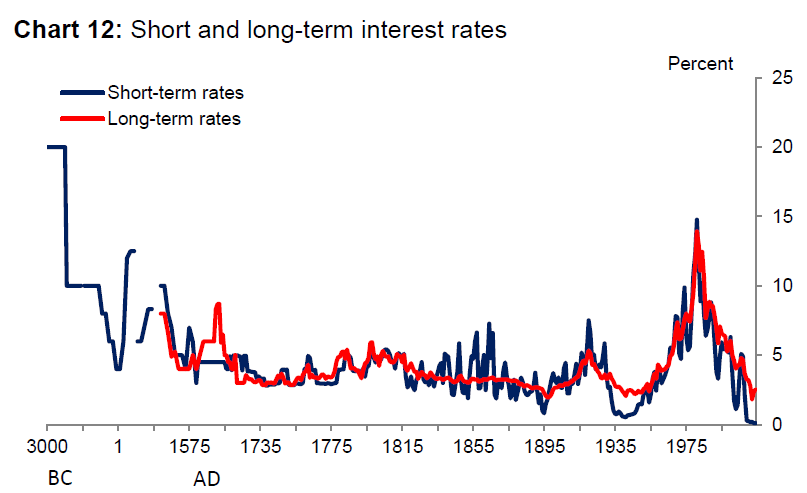
Source: Bank of England “Growing, fast and slow”
4. NZ’s interest rate limbo dance towards greater patience.
The neutral interest rate in NZ has also fallen, in keeping with the experiences elsewhere in the world and the eyeballing of the earlier NZ rate chart.
We have just gone through and re-estimated where we think the neutral Official Cash Rate sits:
There are two key findings from local and overseas evidence. First, neutral interest rates are now much lower than what they were before the onset of the Global Financial Crisis (GFC), a decade or so ago. Second, it is likely that the neutral interest rate is not constant, but trends over time. Evidence suggests that the neutral interest rate has been on a downward trend since the late 1980s.
Our updated estimates for New Zealand largely corroborate these findings. We now estimate that the neutral nominal Official Cash Rate (OCR) is just below 3%, as opposed to around 5% at the start of the decade. New Zealand neutral interest rates also look to have continued their downward trend.
Our earlier estimation work in 2010 didn’t make any allowance for potential behavioural shifts, such as a renewed shift to being more patient that Andy Haldane delved into in great depth. And back in 2010 we didn’t have much post-GFC data from which to make broader insights into economic factors that could be driving NZ neutral interest rates down.
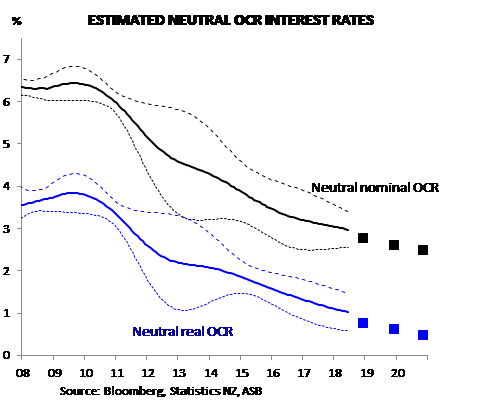
Chart Source: ASB
5. Greater risk aversion is one potential influence.
Blackrock has flagged that a greater focus on saving in liquid assets for a rainy day is one downward drag on neutral interest rates, with evolving global risk aversion getting magnified by the GFC.
From Blackrock’s paper “The safety premium driving low rates”:
The outlook for historically low interest rates is a top issue for investors. Low rates stem from tepid potential growth (ageing populations, poor productivity) and central bank success in achieving predictable, stable inflation. Yet another critical factor is often overlooked: a structural rise in risk aversion over the past two decades. This risk aversion intensifies the hunger for perceived safety in highly liquid sovereign bonds. Such a safety premium magnifies the drop in interest rates and compresses bond term premia.
Changed savings behaviour in NZ following the GFC suggests risk aversion has been a factor here. Lower potential growth through an ageing population and low productivity will also be factors. NZ’s productivity growth has been low over the past decade. Aside from potentially influencing the neutral interest rate, productivity is the vehicle for delivering growing prosperity over the long term – and an area where we urgently need to do better as a nation.
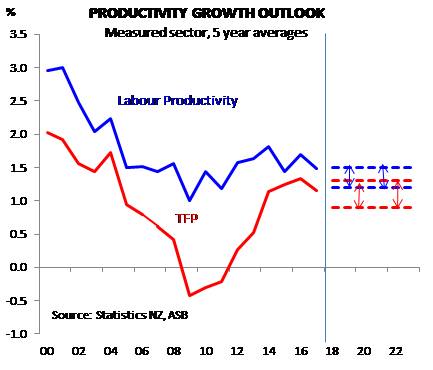
Chart Source: ASB
6. RBNZ needs to limber up to drop its neutral OCR estimate.
It is very important that the RBNZ has a relevant view of where the neutral OCR is – given the neutral rate’s role in benchmarking OCR decisions.
The most recently-published RBNZ estimate was in the August 2017 Monetary Policy Statement, on Page 6:
Relative to estimates of the neutral interest rate, the current level of the OCR implies that monetary policy remains stimulatory. Estimates of the neutral interest rate have been declining slowly for some time. The Bank uses a range of models to estimate neutral and regularly communicates its updated estimates. The mean estimate from the Bank’s suite of indicators suggests a neutral rate of around 3.5 percent at present.
Our latest work points to neutral being on the low side of the RBNZ’s estimate above, though the Bank may have a more up-to-date internal figure that it is calibrating its OCR decisions against.
That internal figure matters. Arguably, the speed of the RBNZ’s ill-fated 2014 tightening cycle was predicated on its view back then that the neutral rate was substantially higher than the prevailing 2.5% OCR setting. The RBNZ ripped through the first 100bp of a signalled 260 bp of tightening (see the 90day track on Page 25) in 4 months.
However, the new Governor, new Policy Targets Agreement, and the message from the August 2018 MPS suggests the chances of making a similar mistakejudgement any time soon is small. The RBNZ appears far more flexible now for the neutral interest rate limbo.
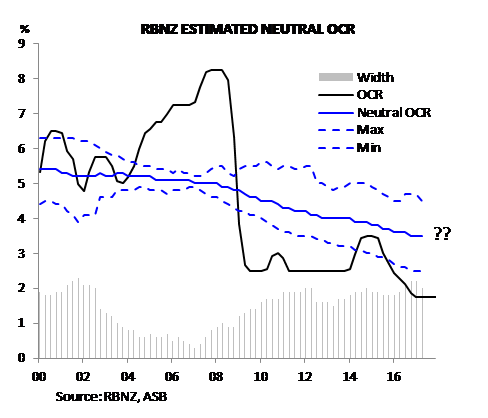
Chart Source: ASB
7. Is it a lower limbo bar for asset yields as well?
A key implication for lower neutral interest rates is that benchmarks for asset yields are likely to remain structurally lower than we were accustomed to in the ‘old’ normal of pre-GFC returns. But structurally lower on average is different from saying NZ (and global) interest rates won’t rise from current below-neutral levels.
Guy Debelle – Reserve Bank of Australia Deputy Governor – sounded a note of caution in his Financial Risk Day speech “Risk and Return in a Low Rate Environment”:
One of the main points I would like to make is that the low interest rate structure underpins many asset prices. That is, asset prices which might look expensive are more reasonably priced given that the rate structure currently is at historically low levels. So in my view, a fundamental question that you need to think about as an investor is: will the current rate structure remain at these levels, or will it return to the higher levels we have seen in the past? If the rate structure remains near historic
lows, then valuations can persist. But if it rises, then asset valuations need to be reassessed. The second and related question is: what is the risk that such a shift in the rate structure occurs and am I being adequately compensated for that risk?
For investors there are some important considerations from lower neutral interest rates, overlayed with Guy Debelle’s cautions:
- Income yields from term deposits, bonds, shares and property are likely to remain low compared to what prevailed in the decades up to the GFC. But yields are likely to rise a little over coming years as extraordinarily easy monetary policy returns interest rates closer to their new – albeit low- neutral levels.
- A significant portion of the lift in global asset values over the past 9+ years can be attributed to a structural adjustment to lower neutral and risk-free interest rates. But any future increases in benchmark yields, such for as government bonds, to reverse the current undershoot of neutral rates, will put some acid on assets to demonstrate earnings growth potential to help support valuations.
Image source: Investing.com
And if you want to know what a real life limbo dance record is, according to the World Record Academy the women’s record is 21.5 cm set by a New York State-based Trinidadian woman. It is probably best not to try this one at home unless you have professional medical staff in attendance (this record was set on the US morning programme “Live!”).
Shemika [Charles] said it took a lot of training to get to this point. She practiced four times a day during the summer.
“It's very different and people are more willing to accept something they haven't seen before. I would like to limbo as long as I can but you can only limbo for so long. I can't limbo when I'm 50 or 60 but I'd like to limbo for as long as I can," Charles said.

Image Source: World Record Academy
9. Hard being green when the environment is in the bag.
One of my first reactions when reading the details of the Ministry for the Environment’s (MFE) consultation paper on banning single-use plastic bags is that Kermit the Frog is so right: it’s not easy being green – the choices are not as straightforward as they seem on the surface. This topic has become very relevant to me now that my local supermarket has just phased out single-use bags at the check-out (although the shop-worn bags in the back of my car already get a lot of use). A lot of the focus within the consultation is the marine impacts of plastic products in general. And people who have travelled to populous developing economies have probably been dismayed by how many plastic bags litter streets and fields.
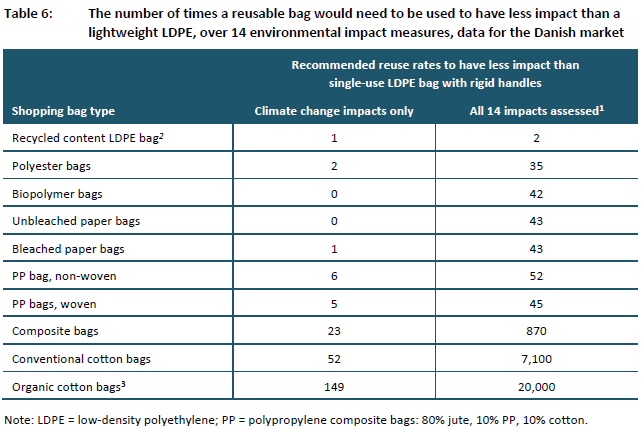
Given these bags look set to disappear one way or another from a shop near you, that leaves consumers faced with figuring out appropriate alternatives. And that is where Kermit might go a little green. The MFE paper cited the following on Pages 40-41:
For example, a Danish study of embodied life-cycle impacts over 14 measures found that people had to reuse paper and biodegradable plastic bags 42 or 43 times before those bags had less impact than a single-use plastic shopping bag; for multiple-use polypropylene shopping bags the reuse rate was 45 to 52 times, and for cotton shopping bags it was 7100 times.
The single-use plastic bag is of a differing construction to what we use here and refuse treatment differs, so the results may not translate directly. But, sobering in the Danish context at least, was what you would think is the pinnacle of environmental caring – a bag made from organic cotton – has a huge environmental footprint. You’d need to use it 20,000 times before it had less of an environmental impact than using single-use plastic bags – 384 years of weekly shopping trips (not counting the impact of some inevitable darning) and an inter-generational heirloom.
10. Understanding ‘whole of life’ on the drive to environmental change.
Another (related) reaction to the report was the importance of doing ‘whole of life’ assessments of the costs and benefits of varying environmental policies or individual actions to ensure that not only is the intended objective being achieved, but that it is being achieved in a manner that minimises costs. And costs extend beyond the financial to include factors such as environmental, quality of life, and the value of people’s time. How does economics fit a shift to environmental sustainability? Economics is all about making the most out of finite resources and enabling desired outcomes. Rigorous cost/benefit analysis helps assessments of the whole of life measurements of policies and activities. Markets, pricing, and internalising the positive and negative externalities all play roles. Capital markets, for example, allocate capital based on expected returns, seeking out the most likely viable technologies.
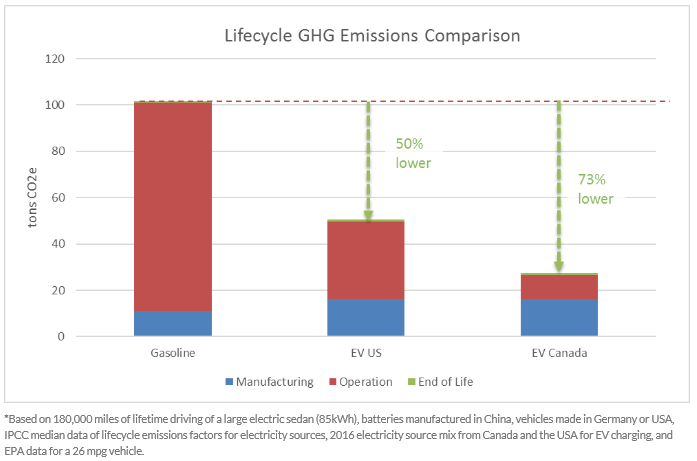
And technology itself plays an incredible role in (literally) driving better environmental outcomes. Tesla booster site teslarati.com examines the whole-of-life greenhouse gas emissions from internal combustion cars and electric vehicles:
These emissions include everything from raw material extraction, to vehicle manufacturing, through operation, and finally to end of life. It’s clear that the reductions from driving [electric vehicles] far exceed any emissions from vehicle production. The savings are huge.
And the article also looks ahead at how the those four life-cycle stages are likely to get even smaller environmental footprints over time for electric vehicles, including considerations of how some of the needed metals are sourced (which in itself has raised environmental concerns in the past).
24 Comments
Thanks - the Tesla one is interesting. Whole of life/circular 'economy' is where you end up, anything above that was draw-down-based and therefore temporary.
Interest-charging was also based on the temporary draw-down, of course - unless we go on upping the 'value' of existing things.
https://www.ted.com/talks/dame_ellen_macarthur_the_surprising_thi...
We need to move to "total cost of ownership" accounting across all items to help drive better decisions. The other one that is often ignores is housing - how much will future environmental impact will be reduced by building/upgrading better now?
Re Tesla, also interesting that their model S was voted most unreliable car in the UK. That doesn’t seem to matter much these days...
although their conclusion was drawn from a sample of 28 owners - and probably a self-selecting sample of the disgruntled.
Note the graph was from Tesla, which has a vested interest in making EVs look good.
Drilling down more, a life of 180000km is more likely than 180000 miles.
With smaller better cars 35mpAmerican gallon is more likely and more is definitely possible.
The graph does not mention diesel at all, which is better again than petrol, especially for larger vehicles.
There is no mention of hybrids.
No mention of replacement batteries(7-9 tonnes CO2 each)
Beware of Geeks bearing graphs...
Drilling down more, a life of 180000km is more likely than 180000 miles.
Lets see the dataset you used to come up with 180,000 kms lifespan then...
Or are you the geek bearing graphs we should be wary of?
Psst; wanna buy a good used Fiat; only 180,000 clicks???
Thought not
Fiat? lol, no. If i buy unreliable Italian crap i go Lancia.. only caught fire twice on me.
But back to the point, how did you determine that Ev batteries would only be good for 180,000kms?
Nissan Leaf batteries appear to be shit, Tesla battery packs, from the limited data available seem to be pretty damn good, but for some reason you've come to 180,000kms.. explain yourself...
In the UK the average age of a car is 6.5 years, in NZ 14
They drive Euro, they put salt on their roads.
We drive Japanese mainly, and any Mazda will do 300-500000km,if you just service it regularly and don't bend it or immerse it in salt.But you should sell any non-Jap car before 5 years/100,000km(Koreans have improved)See "Dog and Lemon guide" on line for Clive's take on EVs(basically get better public transport and stop driving, which nobody wants to hear.
Battery life is time dependent as well as km dependent and varies with depth of discharge/recharge levels and speed of recharge.
A car is often considered uneconomic to repair when the cost of fixing it exceeds the market value.
The main point is that you can construct graphs to sell things by using values without really specifying their origins,details of the data; and time frames are really good at exaggerating differences that may be small in real life.
Or excluding things, like hybrids, diesel and more modern designs, smaller cars.The CO2 cost of replacing and recycling the lithium batteries.
Driving habits will affect the results, open road driving is where EVs do not do so well, but they may be much better on short trips than ICE cars.
So after reading all that irrelevant dribble, you pulled the 180k km value out of your butt is what it looks like.
Much as I suspected.
Maybe I can help you on this... Lithium batteries lose capacity over time, and the typical life for a lithium battery is around 500 charge cycles, where the battery loses significant capacity. A couple of caveats here, fast charging results in a reduced number of charge cycles before the battery loses capacity. This is why Tesla restricts owners from excess supercharge station usage. Also, a full discharge on a lithium battery is far more harmful than a partial discharge cycle. Another way to hurt lithium cells is to keep the cell at full charge for an extended period of time.
Anyhow, ignoring the caveats, to get 180,000 km from the 600 charge cycles provides for 300 km per charge before the battery is considered kaput.
An interesting article: https://www.noted.co.nz/tech/is-the-battery-of-the-popular-nissan-leaf-…
Another depressing link about leaf batteries: https://www.nimblefins.co.uk/nissan-leaf-battery-capacity-range
The chart that shows that the battery health went from 12 to 8 bars after only 50k miles is not good. Unfortunately, lithium battery degradation accelerates with time, so getting one to 100k miles (160k km) would be exceeding expectations. Note that by the time you get to 90,000 km on the Leaf, your expected range will have gone from 275 km to 182 km. Your range at 180k km... well, I'm guessing you will have a honda generator in the boot.
Yep, leaf batteries are known to be shit.. no thermal management at all. They've learned that lesson, the 2019 is coming with thermal management of some sort, I think forced air cooling?
And you can't say life fora typical lithium batttery, is that NCA,NMC, LCO chemistry? Its a bit like saying life for an internal combustion engine is 2000hrs are we talking a briggs & stratton lawnmower engine or a two stroke diesel container ship engine.
So again, we don't know how well EV batteries wlll last, we lack sufficient data.
This from an (complete fanboi website) "study" suggests up to a million kms (but is probably horribly optimistic), https://www.teslarati.com/tesla-battery-life-80-percent-capacity-840km-…
and they have several examples of tesla battery packs going 400,000kms +, but a bit like the courier with the million km toyota hiace van, they aren't normal usage patterns.
That is model S and X batteries, the newer chemistry and construction in the model 3 maybe be an improvement, or it may be worse.
In short, nobody really knows how well EV batteries will last yet, in real life applications. but the fact that most the EV manufacturers are doing at least 150,000km warranties on the batteries suggests that they expect the failure rate by that point to be pretty low, and that will be based on in house tested and data from existing vehicles.
It was fun to look through the crowd-sourced data. I'd suggest looking through the data yourself, and not just the pretty graphs. Some of the data is rather surprising, the number of batteries that were replaced with 20k-30k km is a bit worrisome. Again, look through the data. There are a few high mileage vehicles in the data, with much of the high mileage numbers repeat entries from the same user. Not quite perfect repeats, as many users enter their data monthly with some users having about 25 separate data entries. A big caution is that this should not be construed to mean 25 separate battery data points, but just tracking one battery 25 times. Some of the data reduction assumes separate battery data points in the analysis, so that aspect is rather flawed. The data does suggest that if one doesn't have an early failure in the battery, one should rightly expect at least 180k km from a battery before too much charge degradation occurs. There are quite a few battery replacements listed in the crowd sourced data, some of which are repeat entries. A much higher number of repeat entries have not had a battery replacement. I've not sorted to remove repeats, but my estimate is that more than 10% of the entries replaced a battery, some as early as 2000km, many in the 10k to 30k km range.
Surprisingly, there are rather few entries on the spreadsheet from the US, many more on the Asia, Pacific, Europe tab.
Yep, well aware of the limited data set, but thats the point. No-one outside of the car manufacturers has a decent dataset to predict what current EV battery technology is capable of. Specially with the rapid advances in chemistry and packaging that are being made. So chas's BS 180 km prediction is about as useful as a wet paper bag, and about as solid.
As I said, the fact that pretty much all new EVs are coming with 8 or 10 year/160km warranties (some like (hyundai are doing lifetime battery failure warranty *)already is a positive sign. Just hoping by the time the Honda needs replacement there are models that fall into a reasonable price range and had decent performance. Would rather skip buying a PHEV and go full EV, but if the EVs are still either cheap junk or to damn expensive thats what i'll have to do.
It was instructive to read through various Tesla forums. A very common lament was the unexpected degradation of their battery capacity. A caution about the battery warranties is that they are battery "failure", which doesn't cover battery degradation. If that battery just degrades to partial range, then it hasn't failed, but just has degraded.
A concern of mine was that many people were taking the estimated range numbers as gospel, with only a few people doing consistent calibrated testing to validate the range numbers, or in some cases, expose the optimistic range numbers as becoming increasingly optimistic over time. The numbers in the tesla fanboi crowd sourcing were entirely estimated numbers that are given by the vehicle assuming that you were able to give it a 100% charge. There was zero real world measured data, just estimates provided from the vehicle as to what it thought it could do if one fully charged and then ran it to full discharge. Note carefully that most of the tesla drivers very rarely fully charge their vehicle, and are in fact warned to not leave their vehicle fully charged for more than 2 hours (nor to leave their vehicle for any period of time at a low charge state). This is to improve their battery longevity.
I'm familiar with the operational characteristics of lithium batteries. I use lithium batteries in my hobby, I use a custom charge cycle on my laptop with a maximum charge of 80%, and I am currently designing a high altitude solar aircraft that uses lithium batteries. Want some fun thermal issues, try keeping lithium batteries happy at 60k ft for a year! Of course, this is a rather challenging environment that requires full capacity usage of the batteries during the winter season. My first aircraft design that used lithium batteries dates back a couple decades ago, when the cell quality was really poor. You need to be see a large lithium battery ignite sometime... this is what scares me with using lithium batteries. Then again, petrol can be pretty scary as well, but it doesn't self ignite as easily...
* A caution about the battery warranties is that they are battery "failure", which doesn't cover battery degradation.*
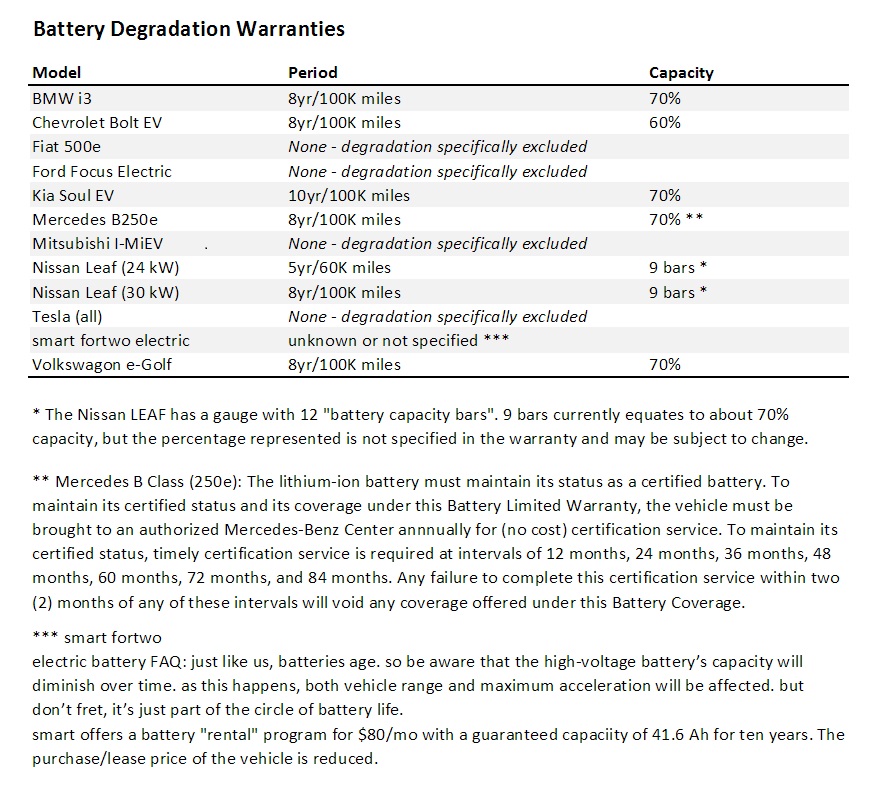
Wrong, most of the EV battery warranties do cover degradation now. https://images.hgmsites.net/lrg/battery-warranties-for-12-battery-elect… thats a bit old, and even though Tesla didn't cover normal degradation, they did replace packs under warranty for abnormal degradation. And now they do warranty the Model 3 battery pack for degradation, 70% and 8 years, 100,000miles or 120,000miles, depending on the pack size.
And I don't recall seeing much in the way of tesla owners complaining about battery degradation when i was reading the teslamotorsclub forums last year when I still had a model 3 reservation.
Looks like the 160k km value up-thread seems to align with the warranty expiration. It looks like many of the battery warranties exclude battery degradation. I'd be a bit less than happy if I had found that my battery had degraded to 65% of its initial capacity and it was still deemed to be acceptable and not covered by a warranty.
I do see the possible benefits of an EV, although my upcoming vehicle purchase is likely going to be an PHEV instead, due to the far increased vehicle carrying capability and utility. I also can see the challenges with an EV. Watch the video here: https://insideevs.com/ruin-tesla-battery-replacement-cost/
It does bother me that if one consistently uses the full range that is indicated or consistently fully charges or discharges an EV will result in an abnormal degradation of the battery.
The next item that will be quite interesting, is when the uptake on EV gets high. The electrical grid isn't going to do well if the majority of homes in a neighborhood have EVs and all are trying to charge at the same time. Just because your connection is rated for 15kW, doesn't mean that the network can deliver that continuously. The overall network capability assumes that the average home is operating at a fraction of the rated capacity.
Tesla shares plummeted Friday after two executives announced their departures from the company and a video of Elon Musk smoking weed and drinking whiskey on a popular podcast began to circulate on social media.
May explain some of Musk's erratic behaviour lately, insinuating paedo, threatening to take Tesla private...
"more likely" evidence please?
a) Tesla is American so mileage seems the correct term b) there are some "projects" with users who's cars do seem to be heading towards in access of 200,000miles.
https://cleantechnica.com/2018/04/16/tesla-batteries-have-90-capacity-a…
"On average, cars with 160,000 miles on them still have 90% of their battery capacity remaining."
In either event the battery life is significant part of a car life heading towards circa 20 years.
To keep you happy here is a km graph, the "collapse" in battery capacity is very flat.
https://www.fleetcarma.com/exploring-electric-vehicle-battery-life-degr…
I suspect early cars were less likely to complete journeys than horses.
How about Scarfie's theory on interest rates. They will always reach a maximum permissible extractive value and then go into permanent decline.
Permissible can be resource limits, or be socially driven.
Come on Nick, you are a wag:
Capital markets, for example, allocate capital based on expected returns, seeking out the most likely viable technologies.
Yes, yes, they can do that, but only sometimes. They also fund all sorts of wasteful non viable ideas and scams along the way. Sometimes (95% of the time in little old New Zealand) they seem to do something else, too, along the lines of seeking to maximise the return on the debt farm.
Did anybody else recognise the chart in #2 as the classical anatomy of a bubble?
As for #3 and chart 12, We all know people who are trying to sell things based on "historical data" which conveniently only extends 30-40 years. It helps the brand ambassadors avoid all the pesky questions from those vile skeptics that just refuse to get on message.
We welcome your comments below. If you are not already registered, please register to comment
Remember we welcome robust, respectful and insightful debate. We don't welcome abusive or defamatory comments and will de-register those repeatedly making such comments. Our current comment policy is here.