

For 15 of the past 16 months, non-bank lenders have written more than $100 million in home loans each month, and probably more than 250 new loans in each of these months. That is their best sustained period since 2006 when they achieved this in 14 of 18 months.
It is hard to call this a rising trend however, given the new impetus 'builds' their market share to just 1.7% of all home loans.
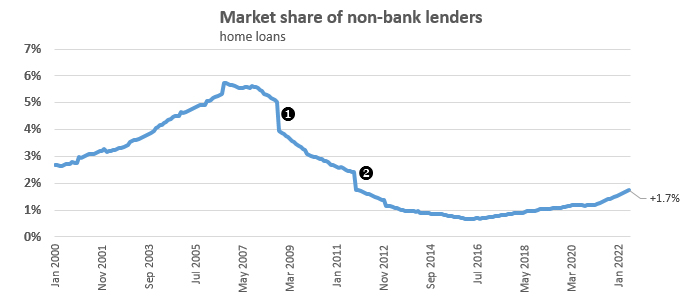
Non-bank lenders include building societies, credit unions, and finance companies. The first two lend like banks, with their principal focus on the ability of the borrower to repay. Finance companies involved in housing lending tend to be more 'asset lenders', more focused on the mortgaged asset value and prepared to be more 'flexible' with the income sources of the borrower and/or blemishes in their past credit history.
Almost all finance company home loans will end up packaged into securitised pools for investors. That is how these lenders refinance their funding requirements.
Over the years, the institutions in the non-bank sector have shrunk, not only from the global financial crisis fallout, but SBS Bank converted from a building society in 2008 (one on the chart), and Heartland Bank made a similar transition in 2012 (two on the chart).
Despite its quite small footprint in the New Zealand mortgage market, the recent expansion has been its best-ever period however.
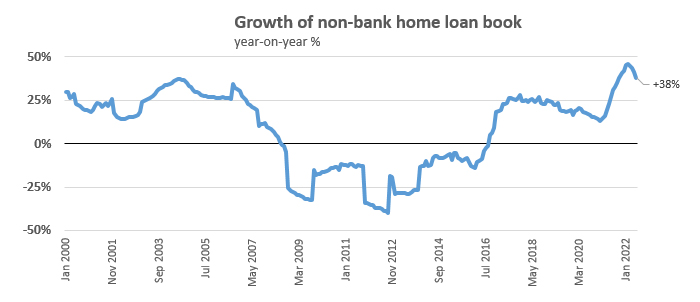
This recent surge comes as restrictions on banks has them struggling to find growth opportunities. In 2022, non-banks have been writing almost 10% of new home loan business, picking up borrowers who can't make the grade with banks. The broker channel is how those borrowers find the non-bank options.
Of course, this shift comes with a cost to borrowers. The interest premium is 'real'. Typically, non-banks lend on a floating-rate basis, encouraged by brokers who undoubtedly tell clients that when their financials improve they can switch back to a bank loan. But non-bank lenders do offer fixed rates, and those with the best financials will pay a lesser premium that way. But it is hard to see why a borrower with prime financials would be a non-bank prospect.
| Loan book | Banks | Non-banks | Share |
| $ bln | $ bln | % | |
| Jun-02 | 70.674 | 2.395 | 3.4% |
| Jun-07 | 138.139 | 8.171 | 5.9% |
| Jun-12 | 171.256 | 2.637 | 1.5% |
| Jun-17 | 235.835 | 1.922 | 0.8% |
| Jun-22 | 333.531 | 5.878 | 1.8% |
We welcome your comments below. If you are not already registered, please register to comment
Remember we welcome robust, respectful and insightful debate. We don't welcome abusive or defamatory comments and will de-register those repeatedly making such comments. Our current comment policy is here.