

Residential property sales volumes surged year-on-year in February.
The Real Estate Institute of New Zealand (REINZ) recorded 5693 residential sales in February, up a whopping 37.9% compared to February last year.
Unfortunately while that is a significant improvement on last year, the latest figures suggest the market remains in a slump.
The 5693 sales recorded in February were the second lowest, after February 2023, for the month of February since 2011.
There have only been three occasions since 2011 when February's sales have been below 6000. They were in 2022 (5739), 2023 (4128) and February 2024 (5693).
So although housing sales improved last month compared to February last year, they are still well below longer term norms, suggesting the market remains weak.
Prices also showed some upward movement but remained well below their 2021 peaks.
The REINZ's national median selling price was $790,000 in February, up 3.9% compared to January, and up 3.1% compared to February last year.
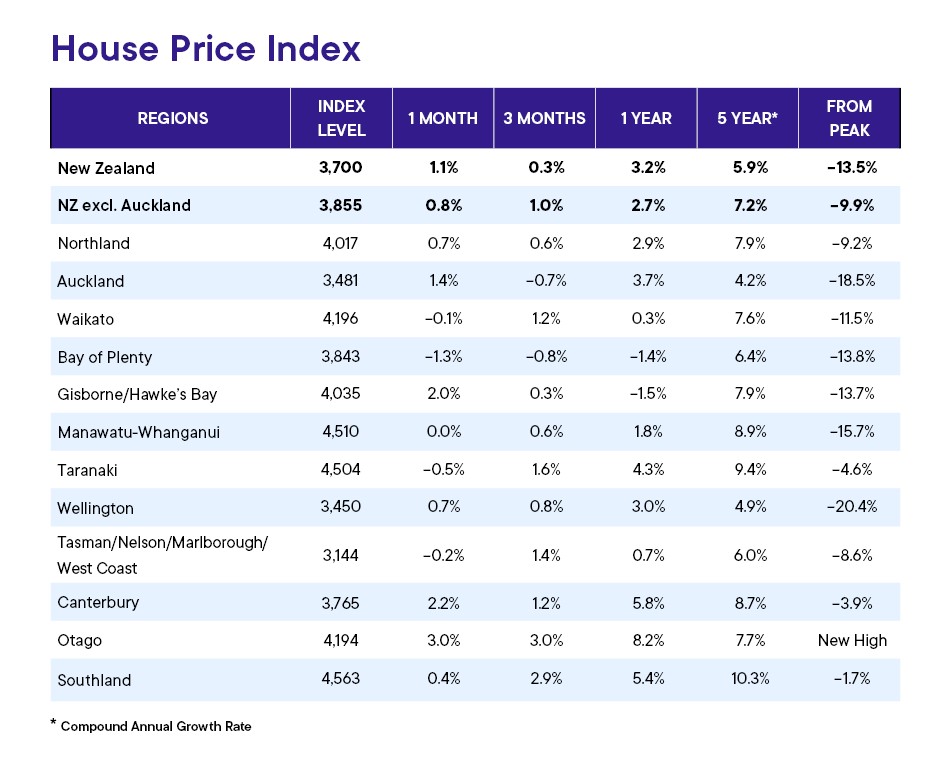
The REINZ House Price Index, which is a more reliable measure of house price movements, was up 1.1% compared to January, and up 3.2% compared to February last year, but still down 13.5% from its 2021 peak. (See the table below for the regional figures).
The comment stream on this story is now closed.
Volumes sold - REINZ
Select chart tabs
Median price - REINZ
Select chart tabs
•You can have articles like this delivered directly to your inbox via our free Property Newsletter. We send it out 3-5 times a week with all of our property-related news, including auction results, interest rate movements and market commentary and analysis. To start receiving them, register here (it's free) and when approved you can select any of our free email newsletters.
92 Comments
Auckland City Median up 16% in Feb
North shore up 11%
My prediction of 10% increase this year already well exceeded!
A cheery top of the morning to you all! ☀️
Recovery is making steady progress.
Avoid getting caught up in the DGM's spiral of negative thinking. (Remember, they stir their tea anti-clockwise.)
TTP
Tea?
We only drink black coffee, double espresso in fact!
I am now questioning my hot drink stirring methodology. Does stirring your coffee anti clockwise also make you negative?
Now that's funny! And, to the point 😆
Just for the record I checked and I'm right handed and stir my drinks anticlockwise. Then again I have the unique ability to put both hands in front of me, finger tips facing each other and go clockwise rotation with one hand and anticlockwise rotation of the other at the same time and switch directions at will. I think I'm Speshal LOL
Luv this comment, insight with sarcastic wit
HPI is the indicator you want to use. Median price just tells you what the house on the 50th percentile mark sold for.
To add to Nellbell's comment, consider what market conditions could cause a higher median with a flat HPI. If everything moved up by 10%, then the HPI would go up 10% - it hasn't. So what's going on? One explanation could be that people who might be interested in the lower half of the market (first home buyers, people on lower incomes, investors) aren't buying, while people who are solvent and own valuable property (older more established owners, wealthier people) are still able to trade.
If lots of more expensive homes are selling, but nothing is moving at the bottom end of the market, you'd expect to see the median move up, with a flat HPI. What's interesting is that if the more expensive homes were going up in value, they'd have lifted the HPI - it hasn't moved, suggesting that while more expensive property is still moving, it's being sold for about the same as it was a year ago, while the lower end of the market just isn't moving at all.
Good to see some sense in the comment section today
Cue the absence of the DGMs from this post.
What’s so rosy about this? For most locations the HPI over the last 3 months is weak
Well at least its not a big drop!
Don’t know if anyone was suggesting it would drop, or drop much. But there were plenty of spruikers saying it has turned a corner.
The March data is bound to excite you even more, John. If you look back at the REINZ volumes chart, March is always the biggest peak in the year, with February up nicely from January.
Personally, I'd be more interested in whether the drop that typically happens after March will be an unusually long drop, especially in a year where a major increase in new listings is causing housing inventory to snowball.
Why is there such a disconnect, between the price expectations of the majority of commenters on this site, and the data, HPI included?
Pretty consistent with my views, Yvil. Which has been for growth in prices in 2024, albeit minimal.
Oh, so you expect house prices to rise over 2024 (slightly), wheras I expect them to fall. How things have changed ! 😅
I have said 3-5%. I now think it might be less, perhaps flat or 1-2%. But yes might fall too!
OCR will be crucial. If it is cut 2-3 times by year’s end then I think 3-5% is plausible. If it’s not, then flat or even small falls.
"I have said 3-5%. I now think it might be less, perhaps flat or 1-2%. But yes might fall too!"
It sounds like you have what it takes to be an economist.
Looks like you can't be wrong with the prediction
It’s a pretty narrow band!
what I am clearly saying is there won’t be significant increases or falls.
I was referring to, they might increase, be flat, or might fall.
the latest figures suggest the market remains in a slump
Yawn. So how many new specu houses have you all purchased in the last quarter....or are you all just ticket clippers riding on others risk?
Please share.
Personally, neither. But I can accept reliable data, no matter if it goes in the direction I expect, or not.
Thankyou Yvil. Anyone else cos silence speaks volumes....
Do you have any surplus popcorn you need to unload cheap?
These days the DGM are choking on their popcorn. 🍿
TTP
Not enough inflation-adjusted housing gains to pay for popcorn.
Let's see what the HPI popcorn cooker shows. Seems to be withheld from public access currently....
"anyone else's silence speaks volume" Like Dgm & It Guy?
by Dgm | 12th Mar 24, 8:49am
All the huff and puff from spruikers have run out of steam..
Evidence is in the data.. and Reinz will show a bigger drop
by IT GUY | 13th Mar 24, 3:33pm
Spooky Spruikers must be very nervous now their Chief Deity is using the MUNTED word
Soon after MUNTED comes CAPITULATION
@averageman I just bough in February for the record, also a house that i own in te atatu south rented in 24 hours, everyone who came to have a look stated their landlord is selling.
Yup. Rented a relative's 2b unit a couple of months ago. Saw 25+ and probably 10 said their LL was selling.
(But is that just a way to toss out tenants so the rent can be hiked big time?)
Thanks SAH. Can you mention the yield or was it for occupation?
In summary, the HPI, the most reliable measure, is up in 10 regions and down in 2, yoy. This, despite interest rates in the 7% for over a year, increasing mortgage stress, high cost of living, difficult trading conditions for many businesses, increasing unemployment. When will house prices start dropping, if at all? (my expectation, as I have said before, is from April 2024, if not I will have to eat a whole lot of humble pie).
Cannot argue with the figures and suggest we are in the Gap period betweenan event and the results - ie Inflation and mortgage costs and other non tradable increases above wage increases and the following reduction in spending leading to liquidations etc, I just cannot predict timing so I am just being patient.
Sales volume is mostly irrelevant without knowing the corresponding number of houses on the market in the periods.
> Prices also showed some upward movement but remained well below their 2021 peaks.
They need to get back below their 2008 peaks to returns to affordability.
Fortunately we have a new government that is absolutely committed to improving housing affordability. As they say actions speak louder than words
- Restoring tax breaks for landlords
- Reducing supply by making MDHS requirements optional
One indicator of this government's commitment to housing affordability is to look at the decision they make in Wellington around the district plan.
The spinoff has been running an excellent series on the housing panel's recommendations and how utterly crap they are. If Wellington City council disagree with the panel's recommendations and opt for loosening planning restrictions then the minister (Bishop) will need to endorse them.
If you have an interest in housing affordability and how planning rules affect it, I'd highly recommend the spinoff series. It's well written and told in plain language which means you don't need a planning degree to understand it.
https://thespinoff.co.nz/society/11-03-2024/the-story-of-wellingtons-ho…
Did Hanlon’s Razor apply? I.e. Did four members of the hearing panel really 'forget' to declare property they owned? Seriously? I, and I expect most property owners, can list at any time all their properties - and shares they own - including which buildings a REIT owns.
And did they record all the people who they had 'conversations' with regards their work? These people are not poor, and neither will their social circles be, so you can conclude that most will own multiple properties and the last thing they'll want will be a flatline like Auckland had post their upzoning in 2016.
What will Bishop do? He'll do as he's told by 7-Houses Luxon and claim 'democracy' has spoken through the hearing panel. (Yeah, I'll be throwing up too.)
But taking the 100 year view - do we really want more deaths in Wellington when the big one hits?
Democracy in the same way that the Enclosure Act in the UK was democratic. The actions of the people on this panel are revolting, and the level of entitlement mentality so stratospheric one can only imagine it won't be long before they decide that while others should not be allowed to live in their favourite areas, those same others should have to stump up to pay for waters infrastructure in their areas.
… is that you National party spokesperson?
Volumes up a tiny bit. A good sign.
Will wait for March before declaring a bottom. But if volumes for March decline (yoy) then the bottom is not in and declines - albeit small - will continue.
FHB would be well advised to keep their deposits in the bank earning interest until at least November '24. By then, the big the mess created by the RBNZ, assisted by this government's austerity measures, will be clear and hopefully they'll have more certainty around their employment prospects.
Auckland will be a bit different. There may be further declines, albeit small - or the flatline will re-establish itself - but I'm leaning towards the former.
I wouldnt be declaring a bottom until after July when 3 years worth of properties are released back to the market when the Brightline period is set back to 2 years. If this results in a large number of investors and holiday home owners selling up then we aint seen nothing yet.
The consensus of people replying to this comment every time it gets posted in that the additional volume will be small and unlikely to have much effect.
(BTW - I'm not calling a bottom yet.)
I guess I'm a DGM because I think the market still has further to fall.
My take would be that only ones buying are optimists or those who have plenty of cash and don't care if they pay over the top.
Most of the rest of the potential house buyers are pessimistic about house prices increasing or cannot afford to buy.
The latter outnumber the former by a significant margin, hence the low sales volumes.
In real terms housing still going backwards. Using Jonkey's resignation as a barometer, I see nothing but headwinds.
Hope this satisfies the spruikers.
Great to see a 5 Year Annual Compounded Growth Rate on the table. Would be great (or not) to see a 10 year one.
The Rule of 72 says you need a growth rate of ~7.2% p.a. to double your money in 10 years (in reference to the old chestnut that house prices double every 10 years.)
Auckland is showing just 4.2% p.a. which is a bit more than what I'm seeing in recent auctions (about 3.6% but I'm going back to 'last sold date' and not to an estimated value 5 years ago, which btw, isn't showing a huge difference between properties bought in the boom vs. those bought 20 years ago. That's very weird. Very weird indeed, huh? But auctions are a bit different and only make a fraction to total sales).
Auckland sales pcm average for 2008-23 was 3300
Meaning that the 1685 this month is roughly 50% below average.
Comparison with last Feb is spurious due to impact of cyclone
As stock of total housing is around 170,000 higher than in 2011 (using 3 persons per dwelling) given pop increase if 500k since 2011, sales as a % of stock probably at 30 year low
REINZ refers to this level of sales as robust
All good points.
Interest on mortgages double what it was 2 years ago
GDP zero last year
Unemployment rising
China in deflation and pretending they have 5% growth. Japan, EU and UK in recession. War in Gulf pushing supply cost inflation up again
These are facts, for mentioning of which myself and others are dismissed as gloom merchants. Well if so, the optimists should be known as Pollyannas
Has anyone got the HPI report? I have been trying but keep getting to a “ member only” page. I may be accessing the wrong way… but is the same way I do it every month
I get the same, Nellbell. I hope you don't have to become a member now to access this report? Is this an attempt to keep the figures away from prying eyes?
Suspect we can’t Tuisbest, pretty sure it’s for members of the Real Estate institute. Other data like last sale price is getting harder to find also in my area also. A number of houses here bought over the high period don’t show the sale in the property history on the RE listing, often listing for more than they paid for it back in 2021/2022.
So frustrating, Nellbell. I've always been able to download the HPI report.
Latest sale price is definitely getting harder and harder to find - and I think we all know why.
Very annoying. Hopefully it’s just a data admin mistake.
if anyone has the Auckland central HPI number I’d be grateful if you could share , thank you!
Update: they've restored access to the HPI report without requiring a login.
Phew
It would be interesting to see a chart that overlays the number of listings to the number sold.
A 0.3% rise over 3 months with almost record low volumes and the spruikers are frothing at the mouth.
This must be very disappointing for many here who were predicting a property crash.
On the other hand it must be disappointing for some here who said the market had turned and that there will be 10% rises in 2024.
To be fair, its only the data for Feb. There is plenty more to come in the story of 2024...
I hear no fat lady singing.
no body shaming please! ;-)
Curves are good, like downwards trends in the property market. Good for our kids and the future of NZ
Looking at whats going on generally in the economy, Im not sure how anyone can reasonably expect anything else happening this year.
I hope this gets reported on. Labour still lying through their teeth. https://www.nzherald.co.nz/nz/politics/labour-claimed-there-were-346-la…
Gosh that story doesn’t say much about their analysts. Make me worry sometimes about the people running our country
You assume it was a mistake. It wasnt, it was deliberate. The Greens (Chloe in particular) did the exact same thing - claimed the number of "rich" landlords based on the number of bonds filed, without mentioning that professional property managers are legally recognised as the "landlord" in the case of bond filing.
Both the Labour and Greens have form in promoting deliberately misleading information, hoping no one catches them out, and if they do it doesnt matter as the news headlines have already been and gone and the public misinformation is buried or corrected in a manner that nobody notices (like buried on page 50 in the small fine print under an ad for incontinence pads lol).
Not so much a mistake, at the very least incompetence - no training or experience at all in dealing with data. But yes, may be worst case of knowingly totally misrepresenting the situation. Either way, I fear we are in trouble with these people at the helm…… and I mean the whole damn lot of them.
So the facts are:
1. The previous government inferred an outcome based on absent data.
2. The current government infers that outcome must be wrong ... based on absent data.
So they're as bad as each other? Who'd have thought (lol)
You can always submit a OIA to the Gov department in question and wait several months for a reply.
I am surprised MSM did not do this. They like to submit OIA's to dig for dirt.
I am sure Bishop will drip feed it to them to keep in the news cycle or awhile longer
"A breakdown of the data shows just 368 entities have lodged more than 200 active bonds - in other words, those entities are each responsible for more than 200 rentals. The number is slightly higher than the Labour figure because it uses a different time period.
That number is broken down into one individual and six companies. The other 368 entities managing more than 200 active bonds are 361 property management companies, which generally do not own the properties themselves, but manage them on behalf of other people."
Pretty shoddy to assume that the bond lodgers are the owners, if that is what Labour have done
Except where the burden of proof lies I guess?
No, the current Govt does have the data (albeit from last year, but that wont have changed in 6 months)
"A breakdown of the data shows just 368 entities have lodged more than 200 active bonds - in other words, those entities are each responsible for more than 200 rentals. The number is slightly higher than the Labour figure because it uses a different time period.
That number is broken down into one individual and six companies. The other 368 entities managing more than 200 active bonds are 361 property management companies, which generally do not own the properties themselves, but manage them on behalf of other people."
Our friends Dgm and IT Guy told me that they're too busy to comment today, so they've asked me to share their most recent post on housing.
by Dgm | 12th Mar 24, 8:49am
All the huff and puff from spruikers have run out of steam..
Evidence is in the data.. and Reinz will show a bigger drop
by IT GUY | 13th Mar 24, 3:33pm
Spooky Spruikers must be very nervous now their Chief Deity is using the MUNTED word
Soon after MUNTED comes CAPITULATION
by Yvil | 11th Mar 24, 2:33pm
Hmmm, I wonder what ratio of positive comments will be made on this thread? Probably the same to any other topic. 20% at best ?
The new government have promised to tackle housing affordability by forcing Police officers to move to Australia for enough money to buy food, thus leaving behind rentals and houses for sale. Genius move!
And doctors and nurses. The escalating number of dead people is freeing up housing like never before.
And bring in millions of immigrants with a treasure chest of rupees to bolster the pyramid scheme.
The headline: From $400K to $1.825m: Sale of Grey Lynn do-up a victory for owners who bided their time
The link: https://www.oneroof.co.nz/news/from-400k-to-1-825m-sale-of-grey-lynn-do…
More pictures: https://homes.co.nz/address/auckland/grey-lynn/8-wallingford-street/8je…
Last sold: Mid July 2003 for $430k
The gross return per annum? ... ~7.3%
But net return? It'll be less once rates, renovations (deck, bathroom). maintenance, cost of sales, etc. are taken into account. Probably still above 6%? And the next owner will still be looking at a considerable sum if they want to bring it up to a more modern specification. They could just landbank and rent it out.
Yes. They doubled their money every 10 years. A rarity. And not on the house but on the land. Look at the pictures & map. Fab location.
The only people fooled by this 'get rich with residential property' nonsense are dumb kiwis with appalling maths skills. A good reno - by real investors - might see the the flippers get back something for the hard work they put in and the risks they take.
They will have more than doubled their money because they probably only put down a 20% deposit for the initial purchase, so 5x leverage.
While paying interest on the 4/5th they borrowed ??? Have you done the maths on that scenario?
Yes. Interest is only paid on the $320K they borrowed and likely fully paid off or nearly paid off at the end of those 21 years. They had about 4-5 years of high interest rates (7-9%) then the rest of that time low (mostly 5-6%). Over the life of the loan total interest would have come to max about $320K.
So they put in $80K, paid up to $320K interest, and sold for $1825K. They also got to live rent-free for 21 years, which would offset the interest.
So yes they more than doubled their money very 10 years.
Holding costs (rates, maintenance, renovations, insurance and interest costs) would be in the $600k range.
The median house price in Auckland is still over a million even after 18% drop from high add in inflation would be around 30% down with rates staying around this level and having very little chance of going back to emergency levels only the top 10% in income can afford to buy a half decent house in Auckland from scratch. I believe most areas will see more price falls over next few years.
House price bulls here is your opportunity to state your case.
Feel free to state your thesis for the house price bull case from current price levels.
The most common theme here is extrapolation of recent house price trends into the future.
Why are house prices in your market / location of interest (please specify) going to rise?
Also those with vested financial self interests / property promoters can refrain from responding.
Luxon: We're back to business mama
10% up this year Guaranteed!
We welcome your comments below. If you are not already registered, please register to comment
Remember we welcome robust, respectful and insightful debate. We don't welcome abusive or defamatory comments and will de-register those repeatedly making such comments. Our current comment policy is here.