
The housing market crashed to Global Financial Crisis (GFC) levels in June.
The Real Estate Institute of NZ reported just 4356 residential sales in June, which was down 25.6% compared to June last year, and exactly a third lower compared to May this year.
Apart from June 2020, when the market was still reeling from pandemic restrictions, the 4356 residential properties sold in June was the lowest for that month since June 2008, which was in the midst of the GFC.
The dramatic slump in sales appears to be almost nationwide, with June sales in Auckland down 35.1% compared to June last year, and sales in the rest of the country (excluding Auckland) down 20.7% compared to a year ago.
Northland was the only region to go against the trend with June sales up 11.9%.compared to June last year.
The biggest annual declines in sales were in West Coast -51.2%, Tasman -41.7%, Gisborne -39.4% and Auckland -35.1%.
All regions had fewer sales in June this year than they did in May (for the full regional sales volume trends, refer to the interactive graph beneath the HPI table at the bottom of this article).
But as bad as those figures are they may get worse, because while sales have declined dramatically compared to a year ago, new listings and the total amount of stock on the market are both up strongly.
According to the REINZ, 7805 residential properties across the country were newly listed for sale in June, up 25.5% compared to June last year.
That means the number of properties newly listed for sale in June was almost 80% higher than the number sold in the same month.
That is causing a huge overhang of unsold properties sitting on the market.
The total residential stock for sale at the end of June was 31,745 properties, up 28.6% compared to the end of June last year.
In a perverse way the price trends are the only bright spots in the latest figures, not because they are rising, they aren't, but because prices aren't falling as fast as sales.
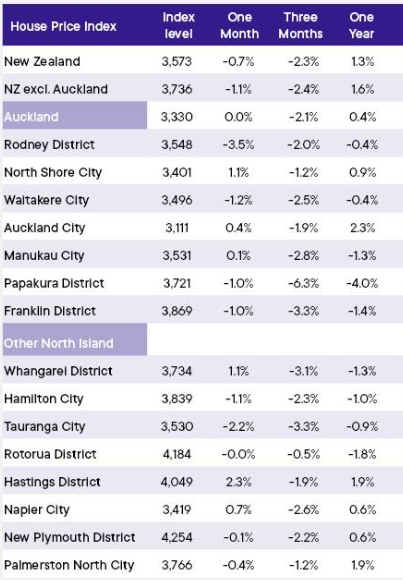
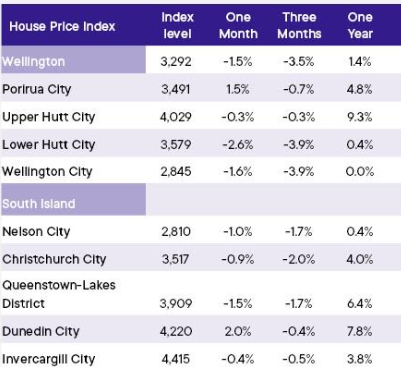
The REINZ House Price Index, which is probably the most up-to-date indicator of price movements each month, declined 0.7% nationally in June and has declined by -2.3% in the second quarter of this year.
The biggest decline in the month of June was -3.5% in Rodney District in northern Auckland, while the biggest declines in the June quarter were in Lower Hutt and Wellington City, both -3.9% (see the table below for the full regional HPI figures. For the regional median price trends, see the interactive graph at the bottom of this article).
The REINZ report on June's sales described the market as "a little chilly amid economic challenges."
"The property market in June is reflecting the wider economic climate in New Zealand," REINZ Chief Executive Jen Baird said.
"New listings have risen, continuing a trend seen in 2024, yet this increase contrasts with a noticeable decline in buyer activity, reflected in lower national sales figures.
"The typical winter lull, compounded by current economic conditions, has contributed to lower levels of activity in the market," she said.
The comment stream on this story is now closed.
REINZ House Price Index - June 2024
Volumes sold - REINZ
Select chart tabs
Median price - REINZ
Select chart tabs
•You can have articles like this delivered directly to your inbox via our free Property Newsletter. We send it out 3-5 times a week with all of our property-related news, including auction results, interest rate movements and market commentary and analysis. To start receiving them, register here (it's free) and when approved you can select any of our free email newsletters.
We welcome your comments below. If you are not already registered, please register to comment
Remember we welcome robust, respectful and insightful debate. We don't welcome abusive or defamatory comments and will de-register those repeatedly making such comments. Our current comment policy is here.