

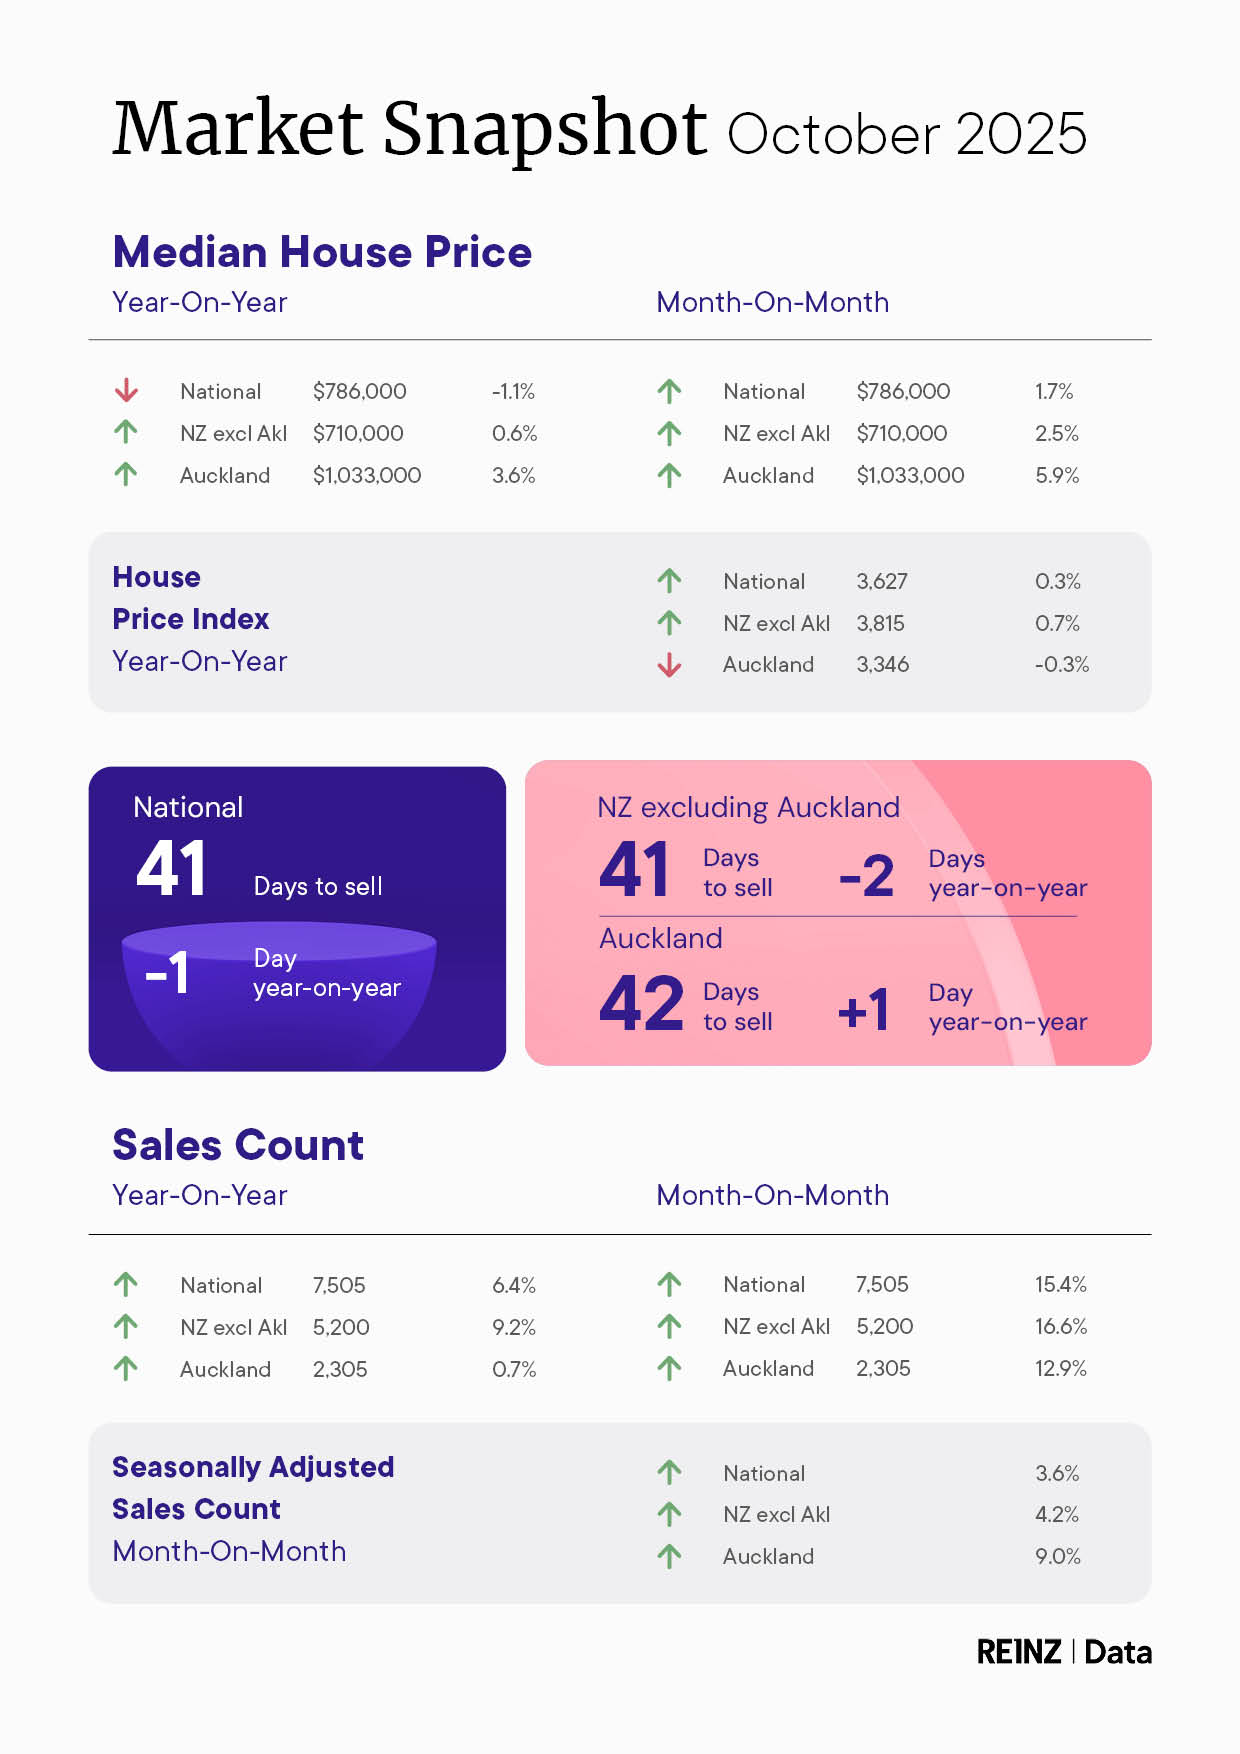
The housing market appears to have made a reasonable start to summer, with 7505 residential property sales around the country in October, according to the Real Estate Institute of New Zealand (REINZ).
That was up 15.4% compared to September and up 6.4% compared to October last year.
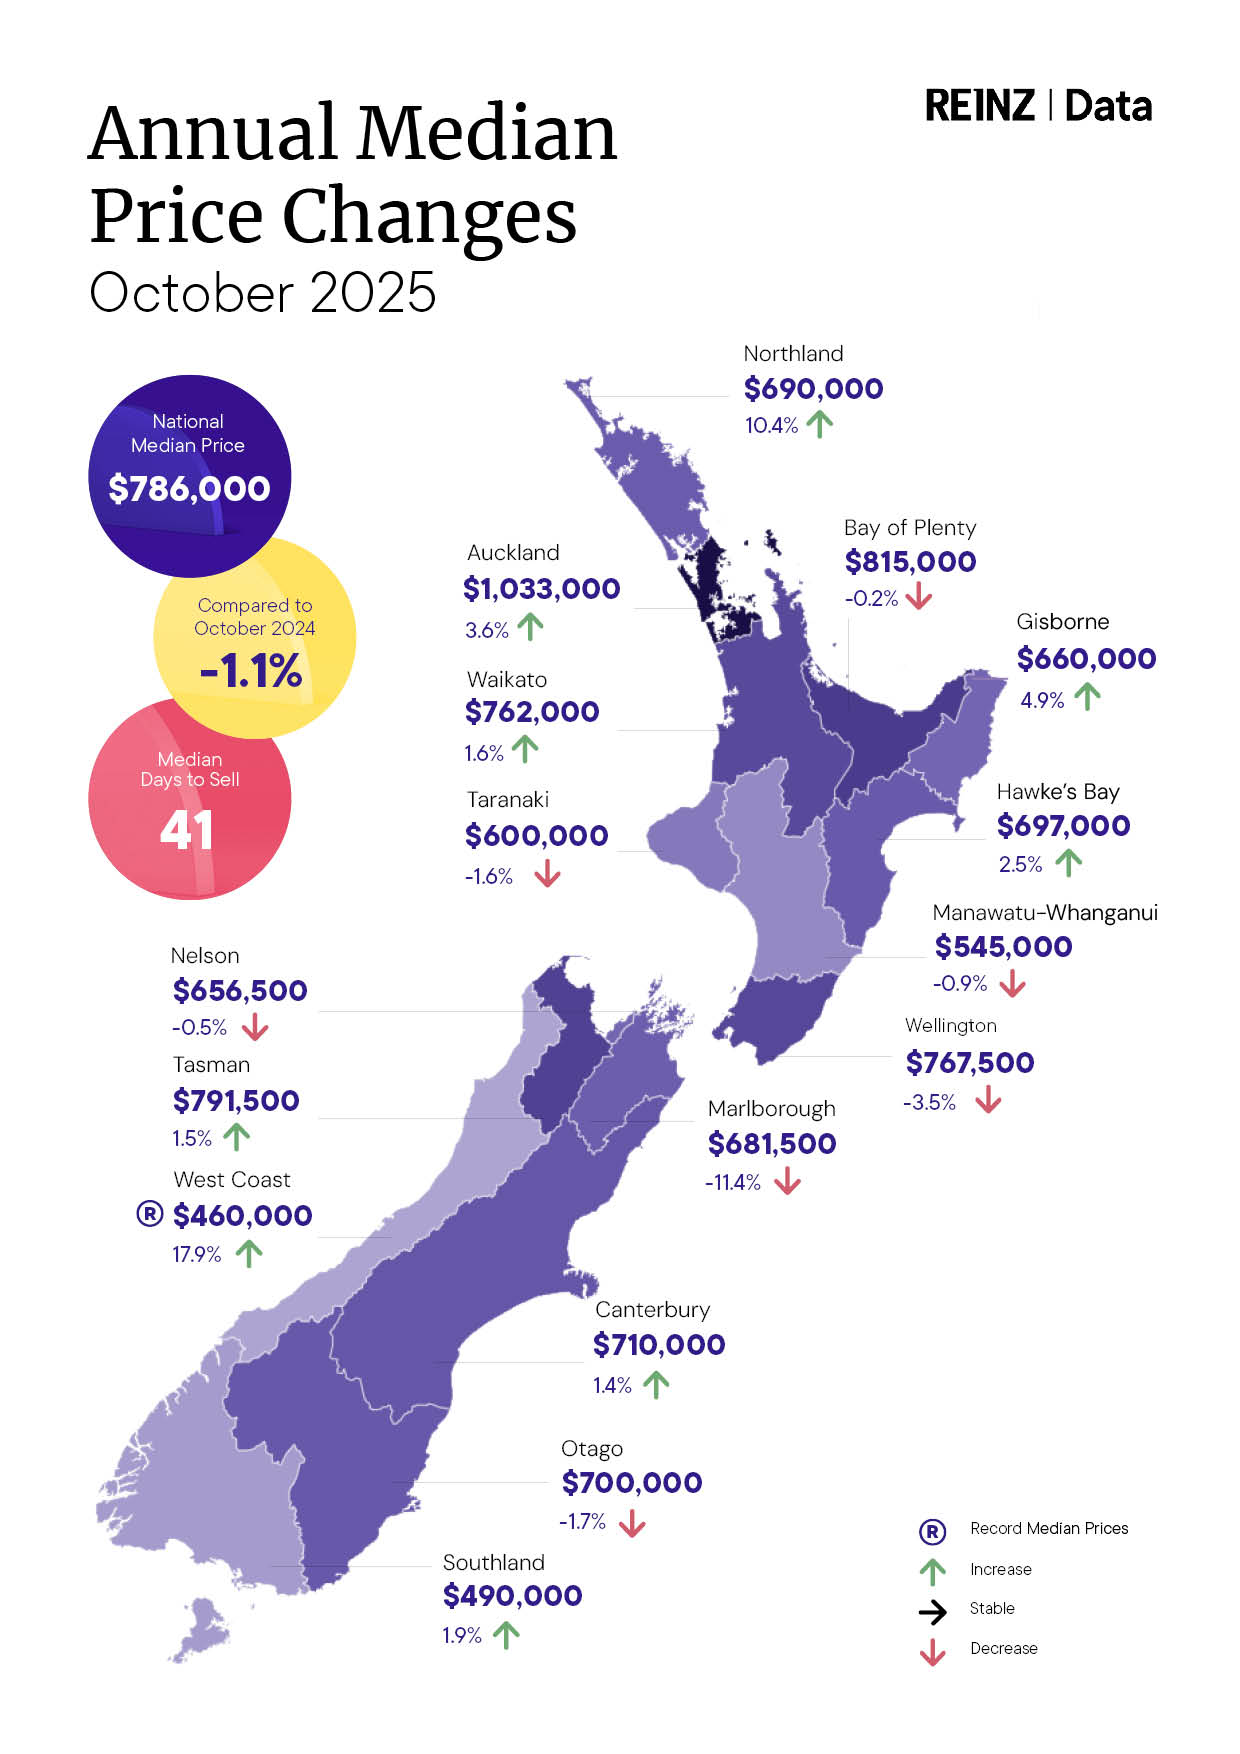
Prices were also firmer with the median house price coming in at $786,000 for the month, up 1.7% compared to September but still down by 1.1% compared to October last year.
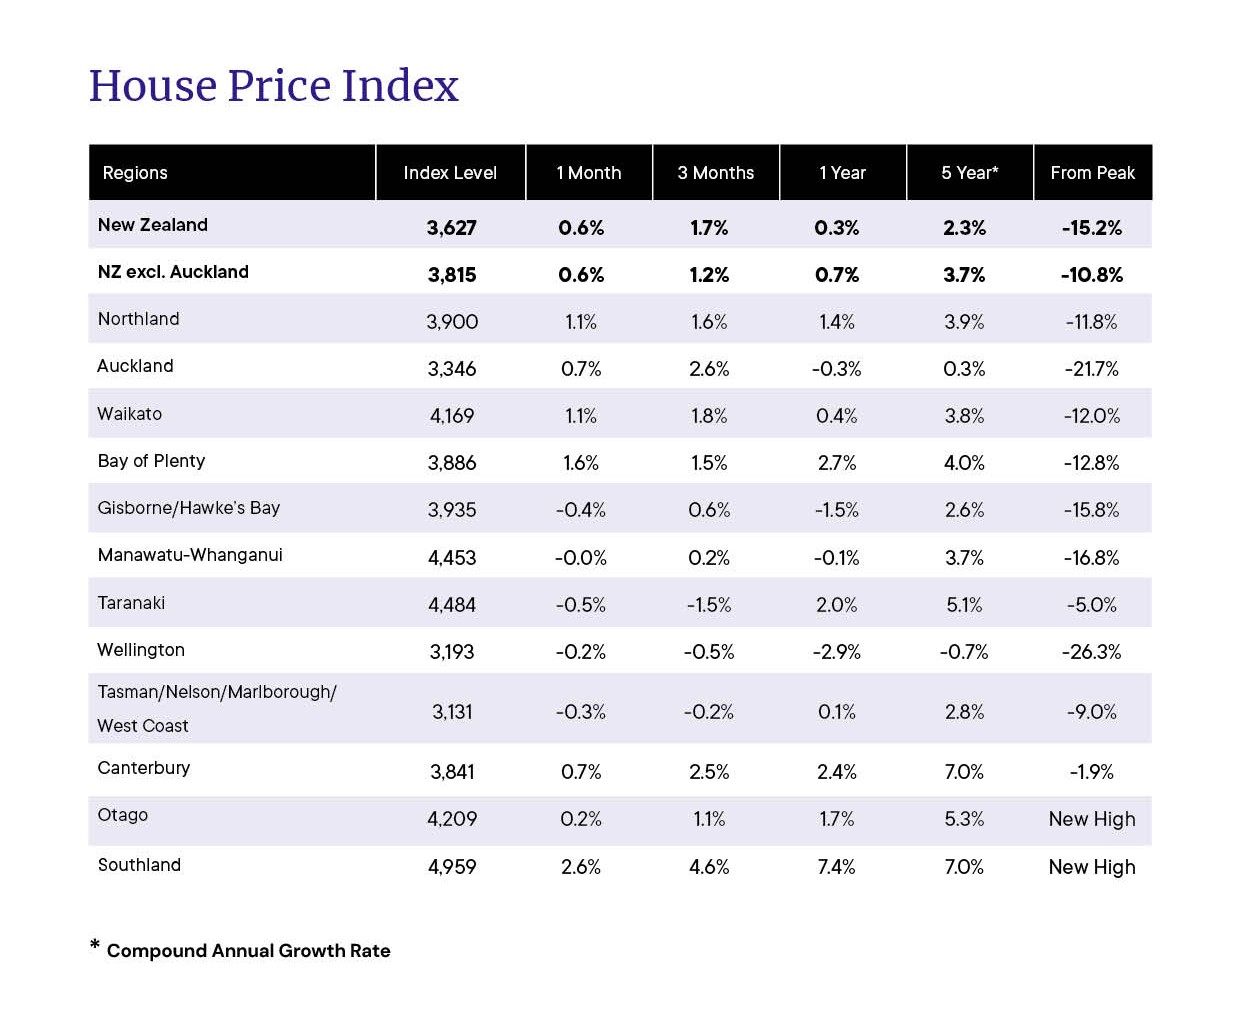
The REINZ House Price Index (HPI), which adjusts for changes in the mix of properties sold each month and is widely considered to be the best indicator of price movements, was up 0.6% compared to September and up 0.3% compared to October last year.
(See the table below for the detailed regional HPI figures. See the graphs below for the long term REINZ median price and sales volumes trends).
"The market appears to have stabilised," REINZ said in its report on October's sales.
"This may be due to median prices remaining relatively level year-on-year across the country."
"Median sales prices across the country have stayed fairly steady in recent months, and this month is no exception," REINZ Chief Executive Lizzy Ryley said.
"First home buyers continue to be a dominant group across the country, taking advantage of lower interest rates and a stabilised market in terms of price , closely followed by owner-occupiers," she said.
"Salespeople are telling us that the warmer weather, lower interest rates and easing lending criteria have brought more people back into the market and boosted activity in many regions, which we can see from the data," she said.
The comment stream on this article is now closed.
Volumes sold - REINZ
Select chart tabs
Median price - REINZ
Select chart tabs

22 Comments
Market shambling along, like the hoards in the Walking Dead.......then over the cliff!
|https://www.youtube.com/watch?v=zRIcdatzjIY
The next leg down is setting up.
Don't be the real estate agents next useful idiot. Only offer in the 2012 to 2015 price range.
While I agree with the sentiment, there is no way you would be buying anything if you are low balling like that. I would love it if that were the case, but the trouble is so would 1000s of other people. So while there might be the odd bargain, seems to me like prices are holding up just fine.
Got any examples of 2012/15 prices being accepted?
Maybe 1000s of other people. But there's also 10,000s for sale.
Any examples of those prices being accepted?
The constant dramatising about the upcoming crash is getting tiresome Gecko.
You been living under a rock?????
THE CRASH IS HERE AND NOW.....and it's not done, doing its very good work !!
Real Residential Property Prices for New Zealand (QNZR628BIS) | FRED | St. Louis Fed
2012 and 2015 prices coming here, and there, to a town near you soon. Don't overpay on todays expected prices - housing deflation is a trend.
NZ Housing market Crash, Crash, Crash.
Triggered ?
Much as I'd love to see cheaper houses, prices have now been flat for nearly 3 years. Possibly a small downward trend in Auckland and Wellington if you squint, counterbalanced by small rises in other regions, especially on the South Island.
https://www.interest.co.nz/charts/real-estate/median-price-reinz
The crash was really a 2022 story.
Are you capable of reading a chart ? You will find REINZ's median price chart above, look at it! It shows no significant price change for the last 33 months. Do you think your "THE CRASH IS HERE AND NOW" relies on better data than REINZ ?
Well...it is peak selling season. Is this all she's got...?
.Sales up 6.4% and HPI up 0.3% for October year on year is hardly the continuing crash you have been posting about.
Printer broken ?
That reply was to your original post, where there was nothing but a dot.
While sales are up they are still miles off peak years. As the spectre of meaningful taxation on housing get closer, the rush to the exits will pickup.
So.... When you forecast a crash, you actually mean prices aren't going to run away on the increase?
There should be a chart outlining what all your hyperbole means in reality.
Hopefully it can be stable for a very long time, that seems like the best outcome for everyone.
Nice to read a reasonable, well balanced post.
Sold LSB first 1.5% above RV and purchased townhouse Kapiti Coast for 7.5% above RV. These will be in the next lot of statistics.
Those interested in facts rather than one-sided hype can look at REINZ's median price chart above. It shows:
An upward trend from $550,000 in Jan 2019 to $925,000 in Nov 2021. +68% in 34 months.
A downtrend from $925,000 in Nov 2021 to $765,000 in Jan 2023. -17% in 14 months
A sideway trend for $765,000 in Jan 2023 until the latest data of $786,000 today. No significant change for the last 33 months.
Nice to read a reasonable, well balanced post.
REINZ can't be trusted
Only when it states what you want it to say ?
REINZ numbers IMO are fair representation. Bear in mind they represent what happened in a prior period as stats do.
REINZ HPI is the best source we have. What do you prefer to use?
We welcome your comments below. If you are not already registered, please register to comment
Remember we welcome robust, respectful and insightful debate. We don't welcome abusive or defamatory comments and will de-register those repeatedly making such comments. Our current comment policy is here.