

The housing market got off to a slow start to the year in January, with sales volumes and prices both lower compared to January last year.
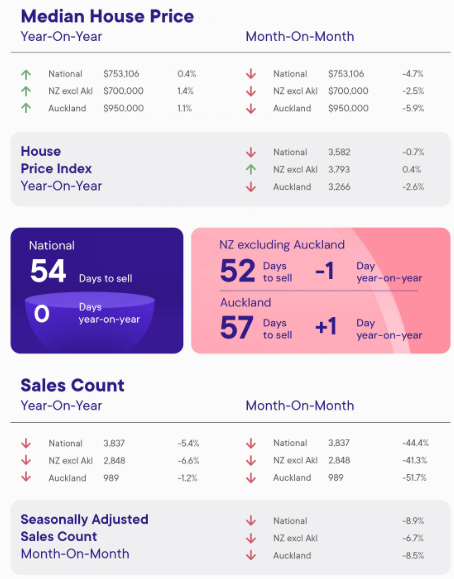
The Real Estate Institute of New Zealand (REINZ) recorded 3837 residential sales across the country in January, down 5.4% from January last year.
In the Auckland Region sales were down 1.2%, and in the rest of the country excluding Auckland sales fell 6.6%.
The sales volume fall occurred as new listings increased by 1.3% in January, while the total stock of properties for sale was up 2.3%.
Prices were also softer, with the REINZ's House Price Index dropping 0.6% compared to December, to be down by 0.7% compared to January last year.
The HPI is now down 16.2% from its previous market peak.
The national median selling price was $753,106 in January, down 4.7% compared to December.
The Auckland median price was $950,000, down 5.9% compared to December.
On an annual basis the national median selling price was up 0.4% compared to January last year, although the trend was mixed around the country, with nine regions posting annual increases in median prices and seven posting declines.
"Interpreting the market over summer can be challenging, as activity between November and February often reflects seasonal patterns rather than fundamental shifts," REINZ Chief Executive Lizzy Ryley said.
"Once seasonal trends are taken into account, the data shows the January market held up well," she said.
The comment stream on this article is now closed.
Volumes sold - REINZ
Select chart tabs
Median price - REINZ
Select chart tabs

29 Comments
Auckland City up 8.7% yoy.
Would be good to own properties in this area...oh wait!
😅🥂
HPI for Auckland city is down 1.9% for the year, making it one of the best performing Auckland regions.
Silver linings though, only down 0.1% month on month. Must be nice to see the blood loss slowing.
Most Auckland regions have now flipped to a negative annual return over five years, as was obvious to see coming in the data a few months ago.
Is it a train wreck waiting to happen? All I see is a lot of properties still advertised at 2021 peak prices, not selling and that shows in the figures: growing pile of listings/unsold properties while days to sell longer and longer (remember when it was ~30 days a few years ago?).
I see prices going sideways for another 12 - 18 months, especially in the places that went crazy during Covid (Auckland, Wellington etc). Other parts (South Island mainly), prices are more likely to edge up (modestly) this year.
Inflation dictates that it isn't possible for the prices to go sideways theoretically. It's only sideways if consistently matching inflation to the tee so I see more loss than sideways in the charts above in real terms.
Sideways is just spin, the truth is they are falling.
That was my point
I meant nominal prices, so yes, in real terms, I see more downside to prices for Auckland, Wellington etc.
The crash continues and z bottom may occur in 2028.
The home collecting addicts dont like the situation, but thats the risk specutown has taken on and getting burnt by!
Thanks Greg, can you please do a article on the median days to sell over past five years by region? Be good to see the data...
Less sales and softer pricing with everyone on holiday or paying all the Tax the IRD requires at this time. So...a normal Jan event unless the RBNZ is stupidly spraying free money everywhere. Accordingly Jan is always an odd time to sell a house.
Nothing to see. Move on.
January has always been a strategic month for house sales with a high proportion of serious buyers(relocations) in the market.
Going to be tricky for the vested interests to spin this into a positive story to support their chants that our: "economic recovery which is well underway" and the "economy is humming."
This countries economy is almost entirely reliant on house prices rising, and it's simply not happening, but we continue to get economists and commentators blowing smoke up our backsides, playing us for fools.
Its an election year!
house prices will not go up with threat of capital gains tax looming
QV numbers last week were also v solid, dont think they were reported here.
🥂🏠✅️
Of course QV numbers would be solid, as they are used to QV by Councils to set their rates. I've never this number reducing. The QV of many districts is totally disjointed from reality.
Depends on which area you're talking about. Down here in the South Island they've been tracking quite closely to actual prices paid, and in many cases are a bit on the conservative side.
South island has been a completely different market lately. Christchurch up 5.4% per year over the last 5 years, Queenstown up 8.1%. Meanwhile in the grim north, Auckland down 1% per year and Wellington 3%. HPI figures.
I disagreed with a lot of what previous poster The Man said, but if he kept up his christchurch investments he has probably done well.
Christchurch is benefitting from the great southern drift. I remember back in the 90s when it was the opposite. Auckland was the be all and end all. How things can change.
Maybe we drift towards where the natural disasters aren't happening. The earthquake has been forgotten and now we are worrying about floods.
The Auckland market movements spill over into the regions with a few years delay
Many who grew up in AKL no longer recognise it and move south to get back lower commute times, new landscapes to explore, and lower crime rates.
Bruce Crawford, you make unfounded assumptions and show poor understanding between QV data and councils.
Firstly, QV is a central government SOE entity quite separate to local councils. QV derive their assessments based on analytical analysis of sales data recorded by LINZ and have no vested interest to ensure their values are “solid” for council rating purposes, and they are subject to review by the Auditor General,
Secondly, there is no need for data to "be solid," as has been discussed many times on this site, the total council rate take is determined by a budgeting process. Rateable values are only used to apportion the total rate take between ratepayers and will not affect the council’s total rate take, and
Thirdly, "I've never seen this number (RV) reducing" is bollocks and shows your poor experience. There are many instances in local council regions where QV have declined between assessments . . . try looking on property history such as in One Roof.
As to QV values being disjointed from reality you might like to refer to interest.co auction data where currently about 65% of properties sell over RV . . . and before you claim that not all properties sell, then appreciate auction is not the best place to achieve the best price as you are dependent on unconditional purchasers who typically are able to purchase at a discount to those who are conditional.
The problem is data provided comes from either government entities, or vested interests. It is not reliable and in all instances is massaged to the point of being misleading and unreliable. For instance one roof and the REINZ have a vested interest in maintaining the positive spin in real estate. Now we get a RBNZ " household survey" being dressed up as to where inflation is going. We have a plethora of surveys in NZ, where results are called data, all commissioned by vested interests, carried out amongst a selected demographic, to provide the desired findings. A similar pattern occurs in the valuation space They are government constructs and entities, and do not provide an on the ground picture. In reality the two valuation tools are closely linked and both are used by council to confirm and justify their rating base.Two similar recent cases in point: The unemployment figure would have been massaged by statistic NZ( they call it seasonally adjusted) to the point of not reflecting the true unemployment rate, which is much higher. The reality is there are very few jobs out there, and to have Willis brushing it aside as there being more people looking for work is nonsense. Unemployment is unemployment. The under utilisation ststistic of 13%, once again massaged greatly is a potent indicator of the true unemployment number. Stats NZ need to please their political masters and positive pro govt statistics guarantee the continued rate of government funding. The same applies to the latest inflation figure, truth be known its at least double that, especially when food prices are rising on average 2 5% per month. The data we are fed is unreliable.
Bruce
Stop showing your ignorance.
Sales data comes from settlement data to LINZ as a land transfer which is supplied by the law firm who have no vested interest in “massaging” information. Neither do LINZ or QV who are central government entities have a vested interest in massaging information.
Yes, REINZ and One Roof have vested interests and are able to be selective in their data.
You comments are baseless conspiracies.
I note you are apparently new to this site; credibility comes from insightful and not baseless comments.
Commentators and economists must live in a parallel universe when it comes to Auckland property prices. They have experienced a significant decline since the 2021 market peak, with values in some areas dropping by nearly 20% by late 2025. Average Auckland home values fell 9% according to council CV data, while broader market reports indicate a "slow bleed" with average values returning to January 2021 levels, representing a potential $320,000 decline for peak-time buyers.
Given New Zealands economy depends almost entirely on cheaply made houses becoming more expensive and evermore unaffordable and in the process locking out future generations of home ownetship.
Now tell me again what a "humming economy", "green shoots" and "an economic recovery well and truely underway" look like.?
Add on the -20% decline in the monetary value with inflation, over the last 5 years.
This takes the REAL property losses to -35% to -45% in the larger NZ cities.
Spruikers, flippers, specuvestors Winning.......
Our weak dollar is reflected in the influx of tourists. It like Argentia was decades ago, their currency then was like ours is today, in the dunny. NZ is now a very cheap place to visit relative to the rest of the world. To overseas tourists we are on a par with Thailand, Vietnam and the Phillipines. But in NZ this tourist influx is portrayed as the overall economy humming. One sector is doing ok but its because our currency is down the toilet and that affects the rising costs of imports and the cost of living.
For anyone interested, from the RBNZ inflation calculator:
Change in purchasing power Q1 2020 - Q4 2025:
-20.7% CPI
-22.8% Food
-19.9% Transport
-25% Wages
-19.3% Housing
Total percentage change Q1 2020 - Q4 2025:
26.1% CPI
29.5% Food
24.8% Transport
33.4% Wages
24% Housing
We welcome your comments below. If you are not already registered, please register to comment
Remember we welcome robust, respectful and insightful debate. We don't welcome abusive or defamatory comments and will de-register those repeatedly making such comments. Our current comment policy is here.