
The national median house price rose to a fresh record high of $427,000 in December despite a $20,000 drop in the Auckland median price.
Meanwhile, the nationwide volume of houses sold in December fell 1.1% from the same month a year earlier with the median number of days to sell unchanged at 32 days, the Real Estate Institute of New Zealand (REINZ) says. Sales of houses under $400,000 dropped to 44.9% of total sales in December from 51.9% in December 2012.
That potentially suggests some impact on first home buyers from the Reserve Bank's restrictions on banks' low equity home loans, which came into force from October 1.
REINZ says the New Zealand median price rose $2,000, or about 0.5%, from November to reach $427,000 in December.
However, the Auckland median dropped $20,000, or about 3%, to $600,000. Nonetheless in the year to December, the median Auckland price still rose $65,000, or 12%, from $535,000 in December 2012.
REINZ also says there were 5,688 unconditional residential house sales in December. That's a 1.1% fall from December 2012, and is down 18.3% from November.
December sales weaker than normal
The Christmas holiday period in December means the month's sales volumes are normally below November, but the latest drop was bigger than normal.
"Over the previous 10 years the average decline between November and December has been 13.6%, indicating that sales in December were not as high as would be normally expected at this time of year," REINZ CEO Helen O’Sullivan said.
"While a small number of regions bucked the trend, other parts of the country recorded significantly greater falls in volume than the national figure.”
“Five regions posted new record high median prices, with some regions, such as Manawatu/Wanganui, Taranaki and Northland seeing sharp increases that are unexpected given the general trend in prices in these regions.
While seasonal volatility may be in play, in some regions the median sales price may well have shifted upwards as a result of fewer sales taking place in lower price bands as compared to previous periods," O'Sullivan said.
“The effect is not seen across the board however, with Auckland reporting a $20,000 fall in the median price from November 2013. Further data is needed over the next few months to determine if this is a new trend, or a short term effect caused by a change in the pace of sales at lower price points given the increased complexity some buyers in these price points now have to navigate.”
The national average days to sell rose to 32 days in December from 31 in November and was unchanged from December 2012. For Auckland the average was unchanged from November at 30 days, but up a day from 29 December 2012. REINZ says over the past decade the national median for days to sell during December has averaged 34 days.
Median price - REINZ
Select chart tabs
'Market activity across most of Auckland region still buoyant'
Of Auckland O'Sullivan said over the past few months the rate of price increase had eased. But market activity across most of the region remained "buoyant" with good open home numbers and continuing listing shortages.
"Sales volume in the Auckland region increased by 1.6% (to 2,201) compared to December 2012, with strength in Waitakere and outer Auckland, but declining elsewhere in the region. Compared to November, sales volumes fell 21.2% (from 2,794), with all parts of the region recording declines, although on a seasonally adjusted basis sales volumes were steady," O'Sullivan said.
"Compared to December 2012 the median price increased by $65,000, with prices increasing the most in Waitakere City and North Shore City. Auckland's median price fell $20,000 compared to November, with all parts of the region apart from outer Auckland seeing a fall in prices. The trend in the median price has eased back, although it continues to improve albeit at a slower rate. The trend in sales volume has moved from falling to steady, while the trend in days to sell has moved from improving to steady. Overall the trend is still improving."
Of the five regions to post increases in sales volume for December year-on-year, Waikato/Bay of Plenty recorded the biggest rise at 9.1%, followed by Central Otago Lakes with 6.8% and Canterbury/Westland with 2.5%. Ten regions recorded a drop in sales volume compared to November, REINZ said, with Manawatu/Wanganui recording the largest fall of 37%, followed by Southland's 26.5% fall and Wellington's 24.4%.
"While the total number of sales was down 1.1% compared to December 2012, the number of sales below $400,000 fell by 14.4%. This follows a fall in sales below $400,000 of 19.6% between November 2012 and November 2013. This may be indicative of fewer sales in the lower price brackets since the imposition of the (Reserve Bank's loan-to-value ratio) LVR restrictions, and a resulting relative uplift in the median price in some regions," said O'Sullivan.
Impact of RBNZ 'experiment' on demand side seen as limited
ASB economists said evidence from the first three months of the Reserve Bank's restrictions on high loan-to-value ratio (LVR) home loans "experiment" suggest a limited impact on the demand side of the housing market.
"Sales volumes are lower, but not by a great deal. And the supply of houses coming onto the market remains exceptionally low. The impact of the LVR restrictions is unlikely to give the Resreve Bank a reason to hold off on Official Cash Rate hikes. We still expect the first hike in March," ASB's economists said.
Of the five regions to post new median highs in December Waikato/Bay of Plenty reached $346,500, Canterbury/Westland $395,000, Manawatu/Wanganui $249,500, Nelson/Marlborough $367,000, and Taranaki $333,000, REINZ said. Compared to December 2012 Taranaki recorded the largest increase in median price, up 18.5%, followed by Canterbury/Westland with 12.5% and Auckland with 12.1%. It was the third consecutive month of record median prices for Waikato/Bay of Plenty and the fourth month for Canterbury/Westland.
Here's REINZ's breakdown of sales volumes by price categories sold in December 2013 versus December 2012

REINZ Stratified Median Housing Price Index
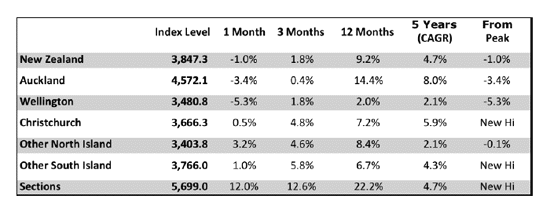
* CAGR is Compound Annual Growth Rate
** REINZ says the Christchurch should be treated with caution due to "compositional changes" in the suburb mix caused by earthquakes.
Here's what ASB's economists had to say in full
Key Figures
REINZ House Sales -0.8% mom (ASB seasonally-adjusted estimate), -1.1% yoy
REINZ Stratified House Price Index +0.1% mom (ASB seasonally-adjusted estimate), +9.2% yoy
REINZ median days to sell 35 days (ASB seasonally-adjusted estimate, previous 34)Comment
REINZ data on house sales for December point to fairly flat sales volumes from the previous month. That contrasts with the Barfoot and Thompson data released recently, which had shown a 7.4% mom drop in Auckland sales. According to REINZ data (using ASB seasonally-adjusted estimates), nationwide sales fell by 0.8% mom, with most of the decline coming outside the main centres. Sales outside of Auckland and Canterbury fell 5% mom.Sales in Auckland were actually up by around 2% and in Canterbury sales volumes were around 1% higher than in November. Sales volumes did drop sharply in November, so sales are still down from where they were before the LVR restrictions came into effect. That suggests some impact on demand, albeit not as much as the B+T data suggested. The REINZ stratified house price index rose by 0.1% in December according to our seasonally-adjusted estimate.
The stratified median price in Auckland fell 3.4% mom, but can be volatile from month-to-month. Looking at the three-month average price for Auckland, the annual rate of increase eased to 13.9%, the lowest annual rate since April. The rate of price increases in the region does seem to be easing from the peak of around 17% recorded in August. Beyond Auckland, prices continue to advance at around 10% p.a. in Christchurch.
Price increases in the regions have accelerated a little over recent months, with the annual rate of growth standing at around 6%. Median days to sell eased a little to 35 in December. Median days to sell plateaued at around 34 over most of 2013, which supports our view that price growth will peak (or has peaked) in late 2013/early 2014. We do expect prices to continue rising over 2014, but at a more modest pace.
Implications
The REINZ figures show that sales volumes are continuing at a more subdued pace that was seen before the LVR restrictions came into effect, but did not show the kind of continued drop-off in sales that other indicators had been pointing to. The LVR restrictions look to have had a relatively modest impact on demand so far. For instance, Auckland sales volumes in December were only around 5% below September levels (on a seasonally-adjusted basis).
While there has been a modest impact on demand, data from B+T and realestate.co.nz suggest that the number of houses coming onto the market remains very low. Exceptionally low levels of inventory will maintain upwards pressure on house prices. The evidence suggests that the rate of price growth in Auckland may have peaked already – but will likely remain strong over 2014.
Although housing market data around the holiday period can be a little volatile, evidence from the first three months of the RBNZ’s macro-prudential experiment suggest a limited impact on the demand side of the housing market equation. Sales volumes are lower, but not by a great deal. And the supply of houses coming onto the market remains exceptionally low. The impact of the LVR restrictions is unlikely to give the RBNZ a reason to hold off on OCR hikes. We still expect the first hike in March.
See REINZ's full press release here and its regional data here.
We welcome your comments below. If you are not already registered, please register to comment
Remember we welcome robust, respectful and insightful debate. We don't welcome abusive or defamatory comments and will de-register those repeatedly making such comments. Our current comment policy is here.