
By David Hargreaves
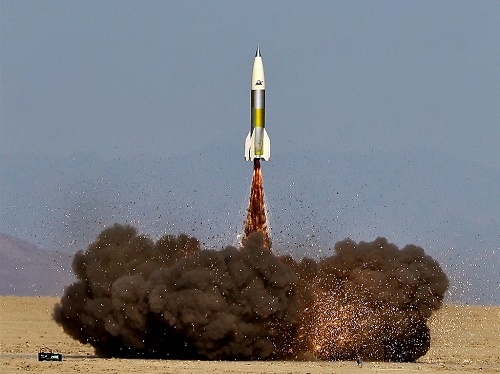
The rocket ship that is the New Zealand housing market is showing no sign of losing impetus, with the average national price rushing past $600,000 for the first time, according to the latest monthly QV figures.
Auckland continued its rapid ascent, with its average price rising by some $552 dollars a day during July and ending the month quickly closing on the $1 million mark.
As of July the average in the country's largest city stood at $992,207, up from $975,087 in June.
The Auckland market has increased 16.0% year on year and 5.2% over the past three months. Values there are now 81.6% higher than the previous peak of 2007. When adjusted for inflation values rose 15.5% over the past year and are 54.2% above the 2007 peak.
The latest monthly QV House Price Index shows that nationwide residential property values for July have increased 14.1% over the past year. Values rose by 6.1% over the past three months and are now 45.4% above the previous market peak of late 2007. When adjusted for inflation the nationwide annual increase drops slightly to 13.7% and values are now 23.5% above the 2007 peak. The average value nationwide has now ticked over the $600,000s and is $602,434.
In June the national average was $590,909, so nationally house prices rose nearly $372 dollars a day during July - though of course that figure does includes Auckland's prices.
QV National Spokesperson Andrea Rush said values continued to rise rapidly in many parts of New Zealand - buoyed by low interest rates, strong investor activity and high net migration.
"Hamilton, Queenstown Lakes and Tauranga have seen some of the highest growth with Hamilton values rising 31.5% since July 2015, nearly twice as fast as Auckland which rose 16% over the same period.
"The Auckland market, however, has continued to accelerate - up more than 5% over the past three months."
Rush said the Wellington and Dunedin residential property markets also continued to show strong growth.
"Christchurch by comparison is showing much more moderate value growth and along with supply meeting demand for homes in the city, there’s now an over-supply of rental properties which is resulting in a downward trend in rents there."
It was too soon to tell what impact the Reserve Bank’s new 40% deposit requirement for anyone purchasing a property they do not intend to live in, would have on the market, Rush said.
"However there are reports the new rules have already led to some offers being withdrawn by investors in parts of the country."
See the table below for the average dwelling values throughout the country.
QV House Price Index July 2016:
| Territorial authority | Average $ current value |
12 month change% | 3 month change % |
| Auckland Areas | 992,207 | 16.0% | 5.2% |
| Wellington Areas | 524,063 | 14.4% | 5.5% |
| Main Urban Areas | 722,243 | 14.9% | 6.6% |
| --------------------------------------- | ------------ | ----------- | ---------- |
| Total NZ | $ 602,434 | 14.1% | 6.1% |
| Far North | 355,485 | 13.6% | 3.6% |
| Whangarei | 421,750 | 19.9% | 6.0% |
| Kaipara | 422,295 | 15.1% | 5.1% |
| Auckland - Rodney | 859,303 | 16.0% | 2.8% |
| Rodney - Hibiscus Coast | 844,826 | 15.0% | 2.2% |
| Rodney - North | 874,992 | 16.9% | 3.4% |
| Auckland - North Shore | 1,160,094 | 15.1% | 5.3% |
| North Shore - Coastal | 1,322,798 | 15.2% | 5.5% |
| North Shore - Onewa | 937,297 | 13.8% | 6.1% |
| North Shore - North Harbour | 1,126,152 | 16.8% | 3.9% |
| Auckland - Waitakere | 782,039 | 13.8% | 3.7% |
| Auckland - City | 1,163,464 | 14.6% | 5.6% |
| Auckland City - Central | 1,003,978 | 14.9% | 4.8% |
| Auckland_City - East | 1,453,988 | 14.8% | 5.5% |
| Auckland City - South | 1,060,567 | 14.0% | 6.4% |
| Auckland City - Islands | 982,998 | 18.1% | 5.6% |
| Auckland - Manukau | 859,005 | 20.0% | 5.7% |
| Manukau - East | 1,100,754 | 18.2% | 5.7% |
| Manukau - Central | 662,182 | 19.4% | 4.5% |
| Manukau - North West | 741,947 | 23.6% | 6.5% |
| Auckland - Papakura | 638,678 | 21.1% | 4.9% |
| Auckland - Franklin | 613,696 | 15.1% | 3.3% |
| Thames Coromandel | 586,608 | 11.5% | 3.8% |
| Hauraki | 307,560 | 18.3% | 6.0% |
| Waikato | 389,220 | 27.5% | 4.2% |
| Matamata Piako | 354,534 | 24.3% | 7.3% |
| Hamilton | 513,094 | 31.5% | 8.9% |
| Hamilton - North East | 659,231 | 33.1% | 10.5% |
| Hamilton - Central & North West | 472,328 | 30.0% | 9.2% |
| Hamilton - South East | 463,194 | 29.6% | 6.5% |
| Hamilton - South West | 449,546 | 31.0% | 7.4% |
| Waipa | 445,080 | 23.2% | 4.7% |
| Otorohanga | 250,202 | 29.0% | 12.4% |
| South Waikato | 159,854 | 24.1% | 5.1% |
| Waitomo | 164,555 | 4.8% | 7.1% |
| Taupo | 393,296 | 13.1% | 3.5% |
| Western BOP | 540,128 | 24.3% | 5.9% |
| Tauranga | 615,625 | 25.7% | 6.6% |
| Rotorua | 338,679 | 24.8% | 9.2% |
| Whakatane | 356,353 | 17.6% | 8.1% |
| Kawerau | 143,765 | 41.0% | 15.5% |
| Opotiki | 238,218 | 18.6% | 5.4% |
| Gisborne | 246,757 | 8.8% | 4.8% |
| Wairoa | 146,174 | 1.1% | -2.6% |
| Hastings | 353,255 | 14.1% | 6.2% |
| Napier | 379,698 | 15.1% | 4.6% |
| Central Hawkes Bay | 233,417 | 12.5% | 3.7% |
| New Plymouth | 389,690 | 8.3% | 1.3% |
| Stratford | 217,705 | 9.4% | 1.1% |
| South Taranaki | 188,513 | 1.5% | 0.2% |
| Ruapehu | 141,512 | 10.2% | 1.2% |
| Whanganui | 200,022 | 10.3% | 4.8% |
| Rangitikei | 156,715 | 9.9% | 7.1% |
| Manawatu | 267,894 | 9.8% | 2.9% |
| Palmerston North | 320,134 | 9.3% | 3.6% |
| Tararua | 155,591 | 2.2% | -0.2% |
| Horowhenua | 234,491 | 12.7% | 8.4% |
| Kapiti Coast | 427,620 | 12.4% | 5.2% |
| Porirua | 429,950 | 12.6% | 4.7% |
| Upper Hutt | 373,082 | 10.6% | 6.0% |
| Hutt | 420,972 | 12.2% | 4.6% |
| Wellington | 633,611 | 15.9% | 5.7% |
| Wellington - Central & South | 632,974 | 14.6% | 6.0% |
| Wellington - East | 704,208 | 17.3% | 6.9% |
| Wellington - North | 558,101 | 16.5% | 5.4% |
| Wellington - West | 732,912 | 16.9% | 4.9% |
| Masterton | 249,667 | 4.7% | 0.6% |
| Carterton | 286,582 | 6.5% | 2.4% |
| South Wairarapa | 329,795 | 8.0% | 3.1% |
| Tasman | 457,542 | 8.2% | 2.5% |
| Nelson | 464,885 | 12.0% | 3.1% |
| Marlborough | 392,566 | 11.2% | 4.4% |
| Kaikoura | N/A | N/A | N/A |
| Buller | N/A | N/A | N/A |
| Grey | 215,864 | 0.3% | 2.1% |
| Westland | 226,176 | -1.4% | -0.9% |
| Hurunui | 367,915 | 5.2% | 2.0% |
| Waimakariri | 429,832 | 2.5% | 1.5% |
| Christchurch | 492,165 | 3.5% | 0.7% |
| Christchurch - East | 373,972 | 4.1% | 0.8% |
| Christchurch - Hills | 674,056 | 4.7% | 1.2% |
| Christchurch - Central & North | 577,863 | 4.0% | 0.8% |
| Christchurch - Southwest | 465,303 | 2.7% | 0.5% |
| Christchurch - Banks Peninsula | 506,657 | 2.1% | -1.6% |
| Selwyn | 531,517 | 3.0% | -0.2% |
| Ashburton | 351,057 | 7.4% | 1.6% |
| Timaru | 323,296 | 5.8% | 0.1% |
| MacKenzie | 355,551 | 16.4% | 1.9% |
| Waimate | 214,782 | 7.8% | -2.0% |
| Waitaki | 241,912 | 6.2% | 2.9% |
| Central Otago | 390,534 | 18.3% | 6.6% |
| Queenstown Lakes | 910,974 | 27.0% | 8.1% |
| Dunedin | 331,967 | 11.1% | 4.5% |
| Dunedin - Central & North | 348,835 | 12.2% | 6.0% |
| Dunedin - Peninsular & Coastal | 294,844 | 6.3% | 3.8% |
| Dunedin - South | 316,332 | 11.1% | 3.3% |
| Dunedin - Taieri | 342,699 | 11.7% | 3.9% |
| Clutha | 174,420 | 3.5% | -2.2% |
| Southland | 219,557 | 1.3% | 1.0% |
| Gore | 196,117 | 6.2% | 3.0% |
| Invercargill | 223,487 | 7.8% | 2.7% |
No chart with that title exists.
We welcome your comments below. If you are not already registered, please register to comment
Remember we welcome robust, respectful and insightful debate. We don't welcome abusive or defamatory comments and will de-register those repeatedly making such comments. Our current comment policy is here.