

There was a two speed housing market in September, with median selling prices falling in Auckland but rising in most other regions, according to the latest Real Estate Institute of NZ figures.
The median selling price in Auckland dropped to $825,000, down 2.1% from its all time high of $842,500 in August.
However it was still 7% up on where it was in September last year.
Within the Auckland region median prices were down on the North Shore -2.4%, Waitakere -5%, Manukau -4.3%, Rodney -5.3% and Papakura/Franklin -1.9%, compared to August.
Only the central isthmus suburbs (within the boundaries of the former Auckland City Council) recorded a rise (+3.9%) for the month.
Fresh record high prices elsewhere
But it was a different story in the rest of the country, with new record high median prices being set in Northland, Waikato/Bay of Plenty, Taranaki, Wellington, Nelson/Marlborough and Otago (you can see the regional price trends on the interactive chart below).
That propelled the national median selling price to an all time high of $515,000 in September.
The median price for all areas excluding Auckland was also at an all time high of $400,000.
There was also significant differences in market activity in Auckland compared to the rest of the country.
In Auckland 2424 homes were sold in September which was barely changed form August, but down 23.2% compared to September last year, suggesting the usual spring pick up in sales has bypassed Auckland so far.
There was also a sharp drop in the number of sales in the Waikato/Bay of Plenty, which were down 9.5% compared to August and -22.5% compared to September last year. In Otago sales numbers were down 6.8% on a year ago.
But compared to September last year the number of sales was up in Northland +4.2%, Hawkes Bay +1.1%, Manawatu/Whanganui +23.7%, Taranaki +3%, Wellington +12.5%, Nelson/Marlborough +2.9%, Canterbury +10.2%, Central Otago Lakes +10.6% and Southland 33.1%.
Overall there were 7397 residential sales in September which was down 10% compared to September last year.
New LVR rules take some heat out of the market
ASB economist Kim Mundy said the Reserve Bank's latest round of investor-focused loan-to-value ratio (LVR) restrictions has taken some heat out of the market.
"Banks were obliged to start complying with the spirit of the new restrictions ahead of their official [October 1] implementation. We expect to see activity remain subdued over the rest of the year as investors up and down the country come to terms with the new rules. These data have no implications for our Official Cash Rate view. We continue to expect the Reserve Bank to cut the OCR by 25 basis points in November," Mundy said.
Mundy also noted that nationwide, the seasonally-adjusted median days to sell lifted for the first time in five months. In Auckland, the seasonally-adjusted median of days to sell lifted to the highest level since August 2014. Even in Wellington, the tightest housing market for some time, the median of days to sell lifted from 24 to 27.
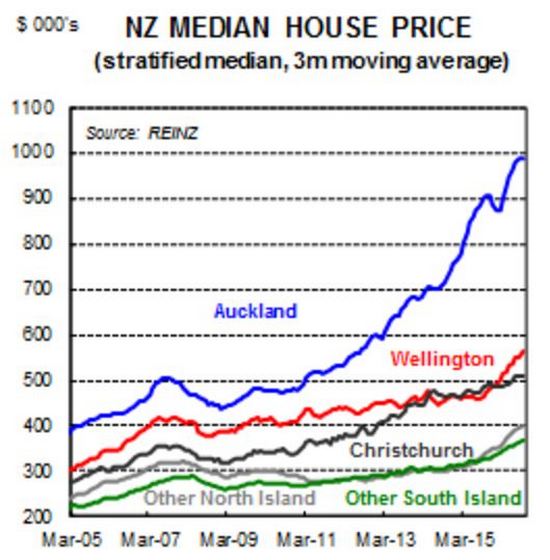
"The lift in the time taken to sell homes comes off the back of a widespread fall in sales activity over September. Seasonally-adjusted sales fell in all regions over the month of September except for the Central Otago Lakes District and Canterbury. Interestingly, the nationwide stratified median sales price lifted in September to $521,150. The stratified median house price also lifted in Auckland (up 2.1% month-on-month) and Wellington (up 4.8%)," said Mundy.
"Despite the slowing in sales over September, inventory levels remain below historical averages. As a result, pressure will likely remain under house prices until supply catches up with demand. In general, recent housing market activity has been supported by robust demand and limited supply. However, the latest round of investor-focused LVRs appears to be weighing on market activity. We expect this to continue to suppress market activity over the remainder of the year,"Mundy added.
You can see REINZ's full regional sales data and commentary by clicking on the following link:
Median price - REINZ
Select chart tabs
The chart below comes from ASB.
We welcome your comments below. If you are not already registered, please register to comment
Remember we welcome robust, respectful and insightful debate. We don't welcome abusive or defamatory comments and will de-register those repeatedly making such comments. Our current comment policy is here.