By Shane Martin & David Norman*


Land can be defined as brownfield or greenfield. Brownfield development occurs on land that has already been developed and therefore has existing infrastructure. Greenfield construction is done on land that has not been previously developed, usually further from the CBD.
Over the three years prior to adoption of the Unitary Plan, the share of development happening in brownfield areas fell steadily.
In the months immediately following the adoption of the Unitary Plan, this trend continued, creating questions over how effective the Unitary Plan would be in stimulating brownfield growth.
However, since the second half of 2017, the market appears to be strongly responding to the Unitary Plan upzoning, with huge growth in brownfield consents, even as total building consents issued also continue to rise.
Why brown is our favourite colour
Development anywhere requires investment in infrastructure that could include waste, storm, and potable water pipes, and road upgrades. But there are advantages to brownfield development.
While brownfield land typically costs developers more than greenfield land, brownfield development benefits the city in several other ways that expanding Auckland’s footprint does not.
It can:
• use existing infrastructure capacity
• create the intensification that makes public transport and other amenities more feasible
• impose fewer external costs (like long-distance congestion) on other users of the transport network.
While some greenfield development will likely be needed to accommodate Auckland’s growth, Auckland Council’s Future Urban Land Supply Strategy (FULSS) has estimated that greenfield infrastructure will cost around $140,000 per dwelling on average, far more than in brownfields.
In addition to using existing infrastructure better, brownfields allow for more viable public transport and shorter distances to a large number of amenities.
Since Auckland Council was established in 2010, there has been an increased push for development that does not expand Auckland’s urban footprint but instead increases density. This has been formalised in both the Auckland Plan and the Future Urban Land Supply Strategy, which both call for 2/3 of growth to be in urban areas.
To enable this urban/brownfield development, the Auckland Unitary Plan (UP), which became mostly operative in November 2016, rezoned large swathes of Auckland for more intensive development. The question that follows is: Has enabling more brownfield development actually stimulated more brownfield development?
Delayed reaction
By looking at the proportion of dwellings consented inside the brownfield boundary, we can see how development trends have changed through time.
Since 2013, the proportion of brownfield residential building consents had fallen.
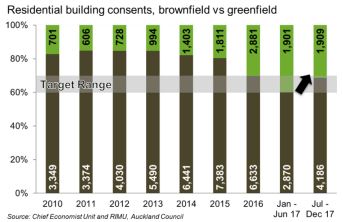
However, the second half of 2017 saw this trend reverse, indicating a lag between enabling development at the end of 2016 through the UP, and development patterns responding. The earliest we were likely to see the UP begin to change where development happened was March or April 2017, as the most on-the-ball developers got their resource and building consents squared away. But in reality, it took three to four months more than that before the pattern began to change significantly.
The monthly data (not shown) indicates from July the trend has been consistently upward month to month.
Additionally, the growth in total consents issued has continued, with 50% more dwellings consented in the last 6 months of 2017 than in all of 2010.
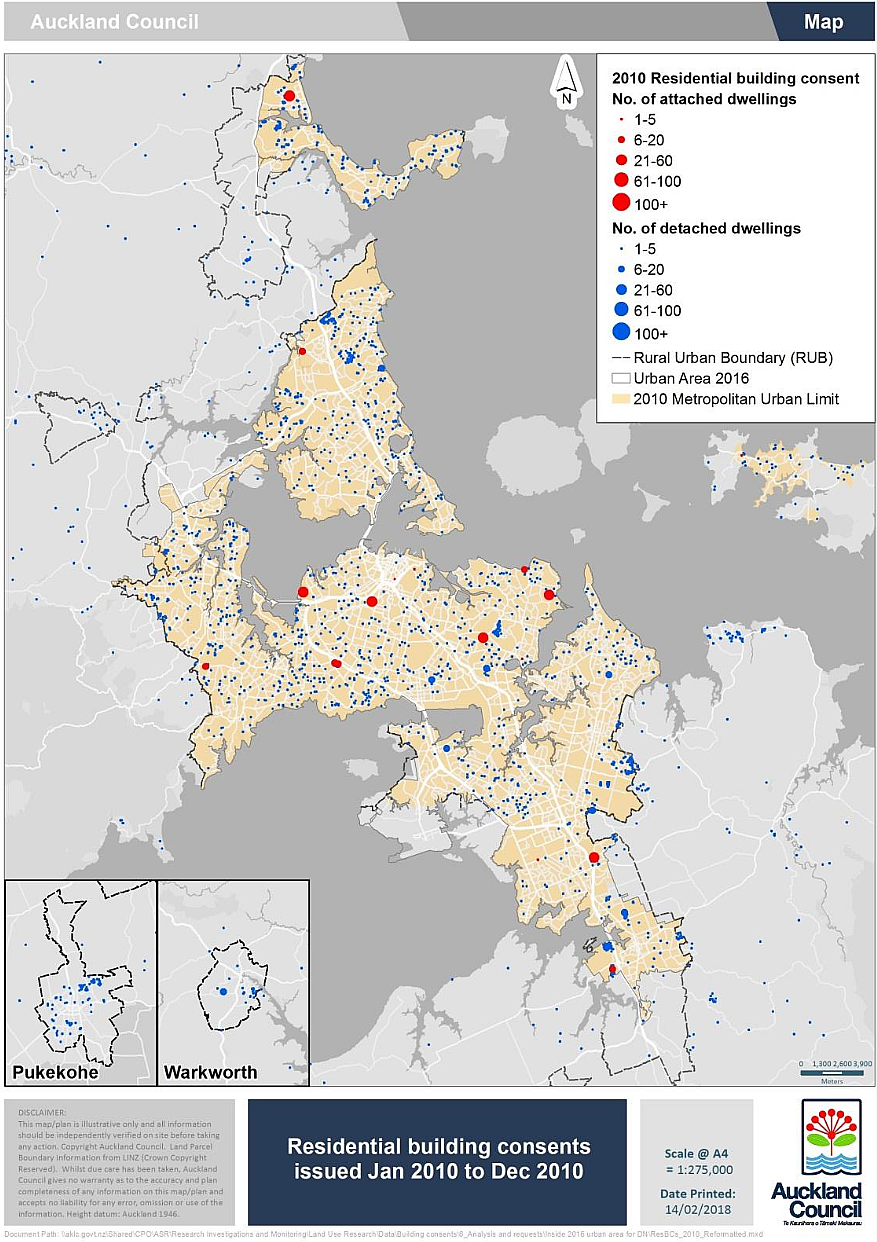
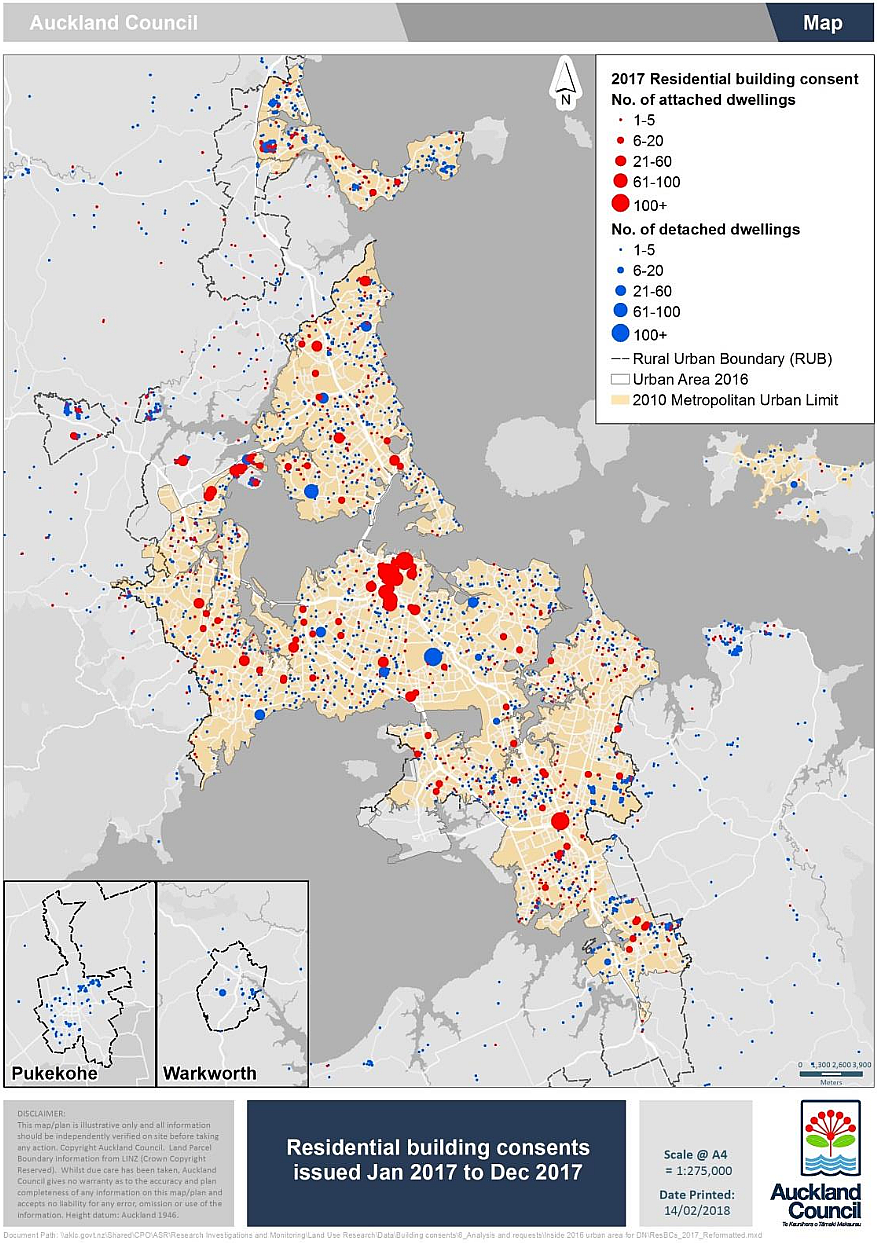
These trends are further illustrated in the maps on the last page of this commentary. The first shows all residential dwelling consents 2010, while the second shows the same for 2017.
Each dot represents a building consent, with the colour and size of the dot indicating the type and number of dwellings on each consent.
The maps also show the brownfield and urban boundaries. These maps highlight at least four trends:
• The total number of consents was dramatically higher in 2017 than in 2010.
• The number and density of dwellings consented near the city centre is much higher in 2017, which is in line with the goals of the UP.
• There is also significant dense development on the city fringes, which is resulting in additional sprawl (see the clusters of development near Albany, Kumeu, Hobsonville, and Beachlands for instance).
• Though detached dwellings (represented by blue dots) are still the predominant type of construction consented, the prevalence of attached dwellings (red dots) has massively increased over the past several years.
If brown is better, why still so much green?
Developers like greenfield projects for at least three reasons.
First, greenfield development may be easier. Developers have larger “blank canvas” pieces of land to work with, and the ability to build entire communities rather than smaller groups of houses.
Secondly, greenfield dwellings can be cheaper to construct. With larger sections, one-story houses are more feasible. Since one-story construction is less expensive per square metre than multi-story construction, the advantages are obvious.
Lastly, undeveloped land is cheaper in greenfield areas in large part because it does not have the infrastructure or amenities that developed land has – as we argued here. Because greenfield developments are not bearing the full cost of the bulk infrastructure they require, this skews the incentives for new development toward sprawl, by effectively subsidising it.
Having said that, enabling more brownfield development does seem to have impacted where new residential construction is taking place.
Where do we go from here?
It is too early to say with certainty that the UP has met all of its goals. However, the recent increase in brownfield development is certainly encouraging. This is something that we will continue to monitor.
The good news does not mean, however, that Auckland Council should not seek to improve its policies and incentives for development. Currently, general rates payers are heavily subsidising greenfield development. Regardless of the geographical patterns of where dwellings are built, we should be striving to ensure that infrastructure is priced correctly, so that it sends the right market signals and so that by and large, those who benefit most, pay a commensurate share of the cost.
The detail: Defining brown and green
While there is a conceptual definition of brownfield and greenfield, there is no statutory definition of what land is currently in each category. As a proxy, we examined Auckland and determined which areas had already been developed. Areas that had already been developed by July 2016 (the nearest review point to the UP becoming operative) are considered to be brownfield. Anything undeveloped by that time is considered greenfield.
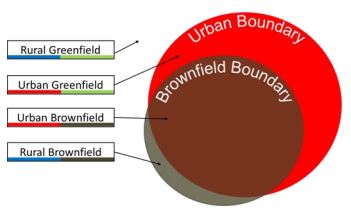
Land can also be defined as urban or rural. The line that divides urban and rural is called the Metropolitan Urban Limit (MUL). Urban land can include both brownfield and greenfield. By similar logic, anything inside the 2010 MUL is considered to be urban with anything outside considered rural.
The reason we don’t use the MUL in our headline analysis is that there are many areas inside the MUL where there is no existing infrastructure (i.e., greenfield). The goal of more compact development is the relative ease and lower expense of development. Using the MUL (which includes both green- and brownfields), does not allow us to track how much development is taking place where infrastructure already exists.
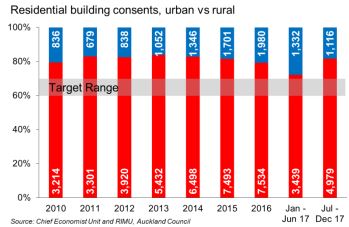
But for completeness sake, we present the data using the MUL definitions in the chart above. The pattern is similar to that for brownfield-greenfield development; development has veered back inside the MUL in the last six months.
*Shane Martin is an economist in the chief economist unit & David Norman is chief economist at the Auckland Council. This article was first published here.
We welcome your comments below. If you are not already registered, please register to comment
Remember we welcome robust, respectful and insightful debate. We don't welcome abusive or defamatory comments and will de-register those repeatedly making such comments. Our current comment policy is here.