
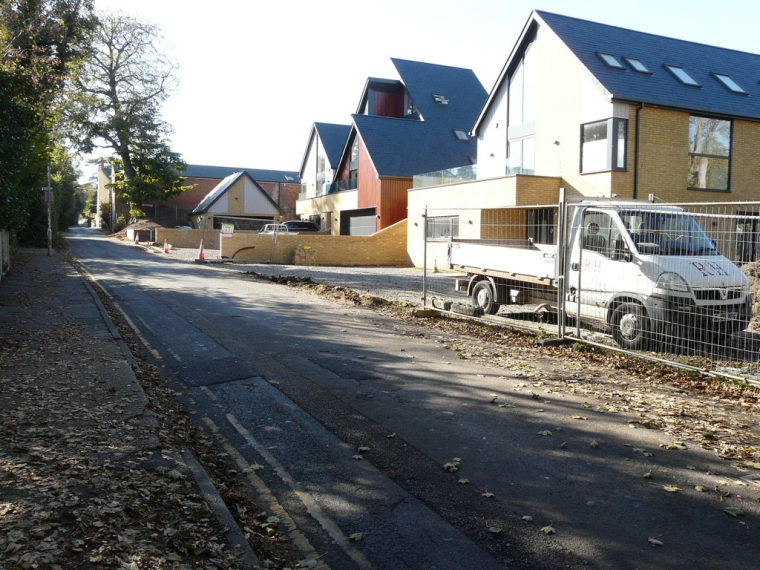
The number of new homes consented in the 12 months to the end of January reached a 44 year high, according to Statistics NZ.
Building consents were issued for 33,576 new homes in the 12 months to January, up 7.4% compared to the previous 12 months, reaching the highest number in any 12 month period since early 1975.
In the month of January 2496 new dwelling consents were issued, up 30.3% compared to January last year
Statistics NZ Construction Statistics Manager Melissa McKenzie said that when new dwelling consent issuance was at its peak in the 1970s, approximately 13 new homes were consented per 1000 New Zealanders each year. In the meantime the country's population had grown from around three million to almost five million, and the latest figures for the 12 months to the end of January showed just seven homes per 1000 people were being consented.
The lowest point was just three homes per 1000 people in 2011.
Stand alone houses still account for the majority of new homes, with 21,270 of them consented in the 12 months to January, although their growth was virtually flat at just 0.6% for the year.
The biggest growth came form townhouses, flats and units, with 6557 of them consented in the 12 months to June, which was up 32.7% on the previous 12 months.
There were also 3757 apartments consented (up 15.3%), and 1992 retirement village units (up 4.7%) for the year.
The growth in consents has been particularly strong in Auckland, where 1128 new homes were consented in January, up 57% compared to January last year.
Of the 13 Auckland Council wards, the highest number of consents was in the Waitemata Ward, which includes the CBD and nearby suburbs such as Parnell, Grey Lynn, Ponsonby and Herne Bay, where 153 new dwellings were consented in January.
That was followed by 136 in Manurewa-Papakura, 125 in Albany, 124 in Albert-Eden-Roskill and 100 in Rodney, with the rest spread among the other wards.
In other main centres, January's consent numbers were also up strongly compared to January last year in the Waikato +20%, Bay of Plenty +87%, Wellington +8.6% and Canterbury +7.5%, while Otago went against the trend with consent numbers there down 15% compared to January last year.
The following interactive graphs track the number of consents issued in all regions each month since February 2000, and the type of dwellings consented each month.
Building consents - residential
Select chart tabs
Building consents - type
Select chart tabs
We welcome your comments below. If you are not already registered, please register to comment
Remember we welcome robust, respectful and insightful debate. We don't welcome abusive or defamatory comments and will de-register those repeatedly making such comments. Our current comment policy is here.