Content supplied by Motu*
The agricultural sector produces 40% of New Zealand’s merchandise exports. Not only is agriculture the primary source of employment in many rural areas, its performance influences the success of urban regions and many secondary industries are dependent upon it.
In this study, we estimate the drivers of revenue and productivity in two key agricultural industries – dairy and sheep/ beef. Together these account for about two-thirds of New Zealand’s agricultural exports.
Productivity is an economic term that, in this case, explains changes or differences in output not explained by use of labour, capital, other expenditures or land. Output is measured as revenue excluding income from interest and dividends. Labour is employees and working proprietors. Capital includes stock, depreciation and rent on tractors, irrigation systems and fencing. Other expenditure includes use of fertiliser, diesel, electricity, wormicide and grass seeds; and land is all the land used for production. Productivity encompasses everything else, including management and worker skills and knowledge, technological improvements, unexpected economic shocks (such as the global financial crisis), changing weather conditions (e.g. droughts), and the inherent quality of each farm.
Data
Our sample includes 83,964 yearly observations from 31,920 agricultural firms. 73% of the observations are from the sheep/beef industry. The proportion of sheep/beef observations fell between 2002 and 2012, with output falling at a faster rate, resulting in dairy firms accounting for over half of the 2012 aggregate output, and a third of all firms by the end of the period.
The data was sourced from Statistics New Zealand’s Longitudinal Business Database (LBD), tax returns (IR10s), and Linked Employee-Employer data (LEED). Information about firm age, location, and industry is taken from the Longitudinal Business Frame (LBF).
Farm inputs are sourced from the Agricultural Production Survey/Census, weather-related variables are collected from the National Institute of Water and Atmospheric Research and land characteristics data from Landcare Research.
The industry
On average, dairy firms produce greater output, but also utilise higher inputs. Dairy firms are relatively less reliant on labour and the quantity of productive land in the production process, with output-per-hectare and the output-to-labour ratios up to three times greater than in the sheep/beef industry. On the other hand, output–to-capital and output-toexpenditure ratios were similar across industries.
Figure 1 shows that the performance and characteristics of sheep/beef firms are more varied than dairy farms Across most variables, sheep/beef firms tend to have a larger proportion of firms operating at a below industry average level. Dairy firms are more homogenous.
Figure 1: Output density across firms
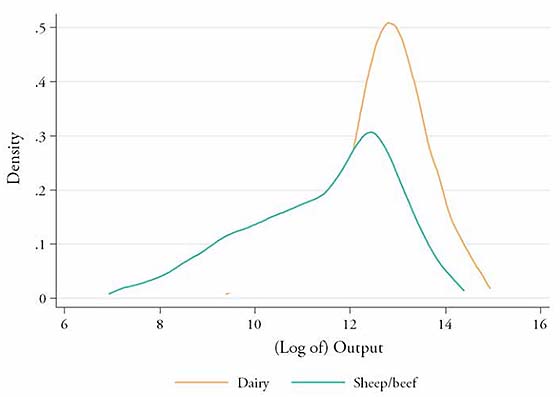
Notes: Plot excludes observations from the top and bottom 1% for confidentiality reasons.
Overall, as shown in Table 1, both sectors display approximately “constant returns to scale,” meaning that a 10% increase in the use of all inputs increases output by about 10%. The increase in mean associated with increases in capital, labour, or land was relatively greater for dairy firms. On the other hand, sheep/beef firms recorded a significantly greater association between intermediate expenditure and output.
In both industries, the capital elasticity was greater than the labour elasticity. The ratio of the two was 1.4, for dairy firms, and over 2.2 for sheep/beef firms. This suggests that the increase in mean output associated with increasing capital (e.g. 10% increase in capital stock) is 40% greater for dairy and and 120% greater for sheep/beef, than the output increase associated with the same increase in labour input (e.g. 10% increase in labour).
Table 1: A 10% Increase in Output at the Mean
| Industry | Output Increase (%) | |||
| Capital | Labour | Expenditure | Land | |
| Dairy | 1.8 | 1.3 | 5.1 | 1.0 |
| Sheep/Beef | 1.3 | 0.6 | 7.3 | 0.8 |
Stock rates and other activity
Table 2 shows that higher stock rates are associated with higher output. Sheep/beef firms that increased their stock rates by 10% increased their output by 1.2%, and dairy firms 0.5%. However, dairy firms experience a greater increase (in absolute terms) in stock rates and output because they are larger and have higher average stock rates, so that a 10% increase translates to a higher dollar value.
Table 2: A 10% Increase in Stock Rates at the Mean (weighted)
| Industry | Output elasticity | Additional units per hectare |
Increase in output per annum |
| Dairy | 0.5% | 1.5 | $1,800 |
| Sheep/Beef | 1.2% | 0.9 | $1,000 |
There is no evidence that non-dairy activity (e.g. forestry work) has any impact on output for dairy firms. However, sheep/beef firms appear to benefit from secondary activities. For example, firms who also owned dairy cattle had an average output up to 4.5% higher, while firms harvesting forest had higher mean output by 6% (equivalent to around $5,200 per annum).
Effect of fertiliser and effluent
With respect to fertilisers on dairy farms, the output of firms applying non-lime fertilisers was 3% greater. The output of dairy firms applying effluent was 6.2 – 6.5% greater than for firms who did not. A 10% increase in effluent application rates (i.e. tonnage of effluent per hectare of productive land) is associated with a 0.15% increase in output, or at the mean, an increase of approximately $500 in output for an additional 13 kg of effluent applied per hectare. Sheep/beef firms are more likely to apply non-lime based fertilisers, and less likely to use lime-based fertilisers and effluent. Sheep/beef firms applying lime and non-lime fertilisers (to any degree of intensity), recorded a 2% lower mean output compared to firms that did not. A possible reason is that these fertilizers are applied as a response to adverse conditions.
Weather and land conditions
With respect to differences in weather and land conditions, firms from both industries were affected by variations in long term weather patterns. For example, a 10% increase in the number of days of soil moisture deficit (from its long term level) on dairy farms was associated with an output drop of 0.3%. Further, while the gradient of the land seem to be an indicator of output for dairy firms, neither the gradient nor capability of the land was related to output in the sheep/beef industry.
Multifactor productivity
For dairy, multi-factor productivity (MFP) of the average firm increased by approximately 1.3% per year between 2002 and 2008. However, the industry recorded a significant drop in MFP levels in 2009 (a 35% fall), and was still lagging behind 2002 MFP levels in 2012, despite some recovery after 2009. In the sheep/beef industry, MFP of the average farm increased until 2008, following a more stable trend than found for dairy. A drop in sheep/beef MFP began in 2008, though it wasn’t as severe as in dairy, and remained above 2002 levels. It is important to note that these findings differ from the MFP figures from Statistics New Zealand. Such discrepancies come about because the two measures capture different aspects of productivity. The official statistics measure changes in productivity for the entire industry, while our measure captures the time-trend of the ‘average’ firm. If, for example, every firm in the industry had productivity growth at the rate we estimate, but those firms with higher productivity grew in size faster than the firms with low productivity, the total industry productivity would rise at a faster rate than the average-farm rate we estimate. Differences are also likely to be due to differing approaches to the variables and methodology used to measure productivity.
Regional differences
Figure 2 shows that there is a large variation of MFP across regions, although we are unable to assess the extent to which these arise from differences between the regions themselves (e.g. access to port, preferable climate, etc.), or differences between the firms in each region (e.g. management skills, access to capital, etc.).
Figure 2: Long-term Regional Difference in Multifactor Productivity
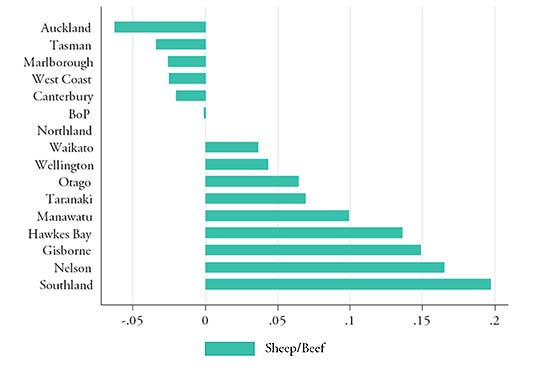
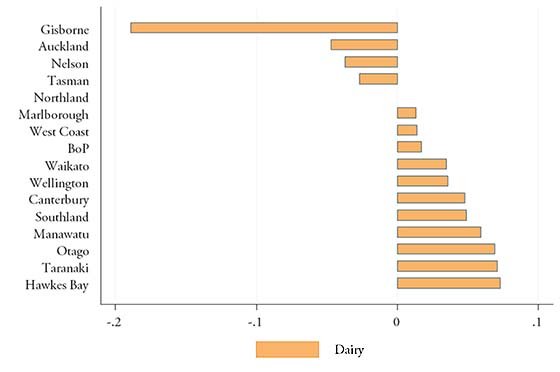
Figure 2 presents the percentage difference in long-term regional MFP. Regional MFP is relative to the Northland region, which is normalised to zero.
Summary of results
Our examination of the data found that most (89-96%) of the variation in output between farms can be explained by differences in the four main production function inputs – capital, labour, intermediate expenditure, and productive land.
Our results suggest that the output of dairy firms was related to the quality of the land used, while this was not the case for sheep/beef firms.
There are differences in the role different inputs have across industries. For example, dairy firms achieve the greatest benefit from concentrating production in their primary activity (e.g. greater density of herd, greater application rates of fertilisers). Sheep/beef firms, however, benefit from the addition of non-primary activities (e.g. producing dairy output, forestry work, etc.).
Between 2002 and 2008, the MFP level of the average firm in the dairy industry increased more rapidly than that of sheep/beef. This has since reversed, following a sharp drop in dairy’s MFP level in 2009. Although some improvement has since been recorded, average MFP levels in the dairy industry remain lower than in the past. There were large differences in the productivity recorded across regional councils.
Finally, we found significant differences in technology across firms with different land size. These were too large to be accurately captured by models that pool small and large firms together with common coefficients. On the other hand, we found large differences in the technology of working proprietor only firms compared to firms with employees. Therefore, while we believe our models approximated the industry level production functions fairly accurately, future studies should consider applying more sub-group-specific models.
Future studies could also build on our work by introducing behavioural or structural elements, or examining how management practices or workforce characteristics (e.g. age, qualifications, etc.) are related to firm productivity. In addition, our methodology could be used as a base to address other questions relevant to this sector (e.g. land conversions to dairy farming).
The working paper “Agricultural productivity in New Zealand: First estimates from the Longitudinal Business Database” by Motu researchers Eyal Apatov, Richard Fabling, Adam Jaffe, Michele Morris, & Matt Thirkettle, was funded by the Kelliher Charitable Trust and the Productivity Hub under the Longitudinal Business Database Productivity Partnership programme.
Motu Economic and Public Policy Research is an independent research institute operating as a charitable trust. It is the top-ranked economics organisation in New Zealand and in the top ten global economic think tanks, according to the Research Papers in Economics (RePEc) website, which ranks all economists and economic research organisations in the world based on the quantity and quality of their research publications.
We welcome your comments below. If you are not already registered, please register to comment
Remember we welcome robust, respectful and insightful debate. We don't welcome abusive or defamatory comments and will de-register those repeatedly making such comments. Our current comment policy is here.