The CFR price for A grade logs in China has stabilised around 110 USD per JASm3, but the market will be closely watching the level of log supply from New Zealand over the next few months. Log demand in China is relatively consistent so any significant reduction in log supply will reduce inventory levels. The monsoon season has arrived early in many parts of India and log demand is expected to remain subdued for Quarter 3.
There is expectation (or hope) that reduced interest rates will stimulate construction activity in New Zealand, but this is not likely until Quarter 4.
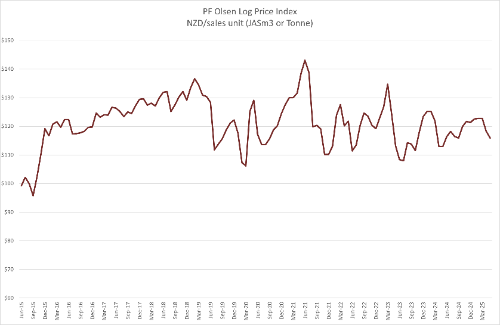
The PF Olsen Log Price Index fell $2 to $116. The Index is now $2 below the two-year average, and $5 below the five-year average.
Domestic Log Market
Many sawmills in New Zealand continue to operate below capacity. There are significantly low inventory levels through the local sawn-timber supply chain. So, when construction activity does increase, there will likely be a shortage of material. Some mill managers think this construction increase could be quite rapid, if the market has confidence interest rates will continue to fall. This increase in construction activity is more likely to occur in Quarter 4 than Quarter 3.
Mill managers report their export markets are very quiet across USA, Europe and Asia due to global uncertainty about markets and geopolitical tensions.
Export Log Markets
China
The CFR price for A grade logs in China has stabilised around the 110 USD level. The domestic wholesale price for these same logs is in the 670-680 RMB range. At these pricing levels the logs buyers are losing money, so this situation is not sustainable. The market requires a drop in log inventory before wholesale prices increase.
China softwood log inventory has fallen about 30k m3 over the last month. However, the market expected a larger reduction in stock. Daily port off-take of logs remains consistent at about 65k m3 per day, so any inventory reduction is reliant on reduced supply from New Zealand.
Log volume arrivals should reduce in China due to less working days in New Zealand in April and the onset of the New Zealand winter. Log production is often maintained initially as woodlot owners/managers try and complete the harvesting of blocks before winter. Everyone agrees New Zealand should supply less volume to China, but everyone thinks someone else should be the one to slow down supply. However, port inventory levels are relatively low around New Zealand and log supply is lower than last year.
The Caixin China General Manufacturing PMI dropped to 50.4 in April, from the previous high of 51.2 in March. This figure however, exceeded expectations of 49.8 and marked the seventh consecutive month of expansion. Sentiment weakened to the third lowest level recorded since this series began in 2012. This highlights the uncertainty in the global and Chinese economies. Yet the biggest driver for log price recovery in Quarter 3 will be the amount of log volume delivered from New Zealand.
India
Log demand has been reduced by the early arrival of the monsoon season in many parts of India. The Gandhidham prices for sawn timber have remained weak around the 491 INR per CFT. The log market is not expected to improve in Quarter 3. Demand will lift again after the Diwali festival in late October. Approximately seven shipments of logs will arrive in Kandla in June. These vessels are from Australia, New Zealand, USA, and South America. Log supply from South America has seen a substantial drop of about 60% since the arrival of logs from New Zealand.
Tuticorin Port is receiving its first bulk shipment of radiata pine logs after a seven-year gap. This vessel will discharge about 15,000m3 in late May/early June before sailing to Kandla Port.
Exchange rates
The NZD has strengthened by about 0.60% against the USD through May while the CNY has strengthened by about 0.90% against the USD.
NZD:USD
CNY:USD
Currency graphs source: XE
Shipping costs
The cost of shipping logs from New Zealand to China had a slight increase for a short time of about 2 USD per JASm3. Demand for ships from Australia increases as companies try and move stock before the end of their financial year of June 30th. This has reduced again now, and exporters anticipate average shipping costs reducing slightly over July and August, as there are more inbound cargoes to New Zealand of PKE stock feed in winter months and fertiliser supply for spring application.
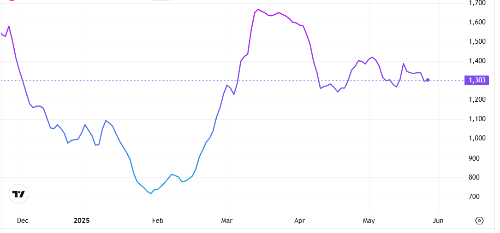
The Bulk Dry Index (BDI) below is a composite of three sub-indices, each covering a different size: Capesize (40%), Panamax (30%) ad Supramax (30%). It displays an index of the daily USD hire rates across 20 ocean shipping routes. Whilst most of the New Zealand log trade is shipped in Handysize vessels, this segment is strongly influenced by the BDI.
Baltic Dry Index (BDI)
Source: TradingEconomics.com
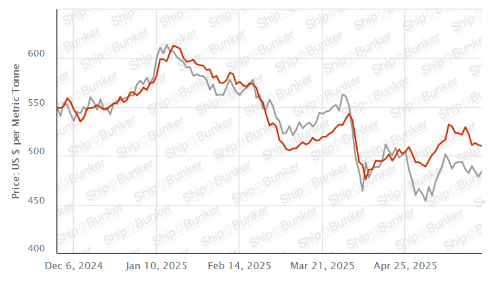
Singapore Bunker Price (VLSO) (red line) versus Brent Oil Price (grey line)
Source: Ship & Bunker
PF Olsen Log Price Index - May 2025
The PF Olsen Log Price Index has fallen to $116. The Index is now $2 below the two-year average, and $5 below the five-year average.

Basis of Index: This Index is based on prices in the table below weighted in proportions that represent
a broad average of log grades produced from a typical pruned forest with an
approximate mix of 40% domestic and 60% export supply.
Indicative Average Current Log Prices – May 2025
| Log Grade | $/tonne at mill | $/JAS m3 at wharf | ||||||||||
| May-25 | Apr-25 | Mar-25 | Feb-25 | Dec-24 | Nov-24 | May-25 | Apr-25 | Mar-25 | Feb-25 | Dec-24 | Nov-24 | |
| Pruned (P40) | 175-200 | 175-200 | 175-200 | 175-200 | 175-200 | 175-200 | 180 | 190 | 200 | 200 | 190 | 190 |
| Structural (S30) | 120-145 | 120-145 | 120-145 | 120-145 | 120-145 | 120-145 | ||||||
| Structural (S20) | 93-100 | 93-100 | 93-100 | 93-100 | 93-100 | 93-100 | ||||||
| Export A | 116 | 120 | 129 | 129 | 126 | 128 | ||||||
| Export K | 107 | 111 | 120 | 120 | 117 | 119 | ||||||
| Export KI | 97 | 101 | 110 | 110 | 107 | 109 | ||||||
| Export KIS | 88 | 92 | 101 | 101 | 98 | 100 | ||||||
| Pulp | 48 | 46 | 46 | 46 | 46 | 46 | ||||||
Note: Actual prices will vary according to regional supply/demand balances, varying cost structures and grade variation. These prices should be used as a guide only.
A longer series of these prices is available here.
Log Prices
Select chart tabs
This article is reproduced from PF Olsen's Wood Matters, with permission.


We welcome your comments below. If you are not already registered, please register to comment
Remember we welcome robust, respectful and insightful debate. We don't welcome abusive or defamatory comments and will de-register those repeatedly making such comments. Our current comment policy is here.