

For most companies, a key operating metric is the gross profit margin, the difference between sales revenues, and the cost of goods sold. Benchmarks vary between sectors.
But in the banking and financial sector, this key metric is net interest margin (or NIM as it is known).
It is a 'simple' difference between the interest the institution earns from its loans, and the interest it pays for its funding.
It is usually expressed as the difference in percentage points.
All sorts of influences weigh on the overall institution NIM, but when loans go bad in their loan book, interest earned will be lower than it should be, and the NIM will contract.
It is the role of bank treasurers to manage the cost of funds (what it pays wholesale funding sources and its retail depositors), and it is the role of bank loan managers to manage what it charges for lending. Risk management is integral to this pricing. Bank CFOs have a big influence over these standards. Internal cost of funds metrics are given to frontline managers on which they are judged. It is these internal metrics you will hear about when they tell you "we can't afford to go that low".
Readers will have noticed that the cost of capital (the return for shareholders) is not part of the NIM calculation. But almost certainly these return requirements are considered 'costs' in the internal management of the bank. The point is, the NIM only measures part (but a big part) of what the directors assess when they review how well managers are deploying their funding.
The NIM is a key metric for shareholders, directors, managers and regulators. It helps them all benchmark one institution with another. The Reserve Bank (RBNZ) Dashboard gives us a crude (but accurate) view of the NIM by institution, but only to one decimal place. These margins are relatively fine and internally they are usually measured to three decimal places. Important progress or declines can show up in the trending to three decimal places, but only pop up in the one decimal place Dashboard data after a significant shift.
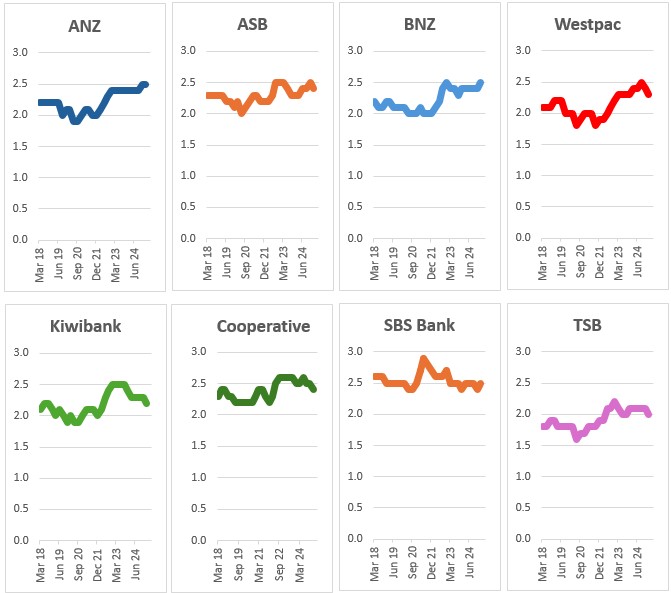
Its arbitrary, but we could consider a 2% NIM as 'normal' in New Zealand. Below this is a sign the institution is operating with tight margins. Above 2% the margins are, as they say, "comfortable". Banks with above 2% NIMs are probably making a lot of money.
Here is how the one decimal place NIMs have tracked since the RBNZ Dashboard data series started in 2018.
Net Interest Margin %
by selected retail banks
One of the reason we cannot independently calculate NIMs is that precisely what goes into both the asset (loan book) base for the interest earned, and what goes into the liability base (funding) is not always clear from the banks accounts. Many will declare the two or three-decimal result in their reporting, but the elements of the calculations are always opaque. This is core bank IP.
But the NIM percentage is one thing. What really matters is the amount of these margins.
Money is a commodity. There is no difference between the nature of [fiat] money between banks. But the more you have the better your results. As in all commodity businesses, volume brings market power. Which goes some way to explain why big banks out-perform smaller ones. Having many transactions at a good 2% NIM is far better than have a few transactions at a high NIM. The reason is obvious - customers will leak away to the deal with the lower margins, all else being equally.
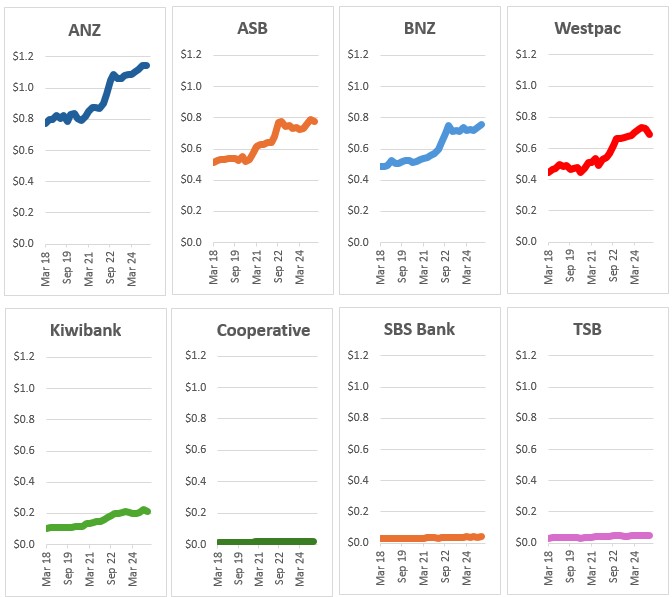
And you can get a good sense of that when we look at the dollar value of the difference between interest earned and interest cost.
The difference between interest income and interest expense
by major retail bank, in $ billions
Over the past five years of Dashboard data, the big banks have managed an average 13% return on shareholder's funds. Kiwibank has managed 7% and at the lower end of that recently. The smaller banks shown above managed even less than that. The relatively low shareholder returns for them is a core problem when they attempt to raise capital to take on the big boys. Why would any investor choose a low-return option when a high return alternative is readily available?
And the inverse is true. Breaking up the big banks will make them less capital efficient, reducing returns and making their ability to raise funding far more difficult and expensive. In turn, that will undermine the goal of 'more-competition-for-lower-prices".
However, if one day one of the big Aussie banks either tires of its Kiwi subsidiary, or needs to raise funds for its own domestic purposes, a move by Kiwibank's owners (Kiwi Group Capital) may well find it quite a lot easier to raise the funds required for a combination. Then the scale problem would be solved and things could get seriously interesting.
1 Comments
This went under the radar a bit when it happened. Heartland had an online only mortgage product, but even then has decided to just exit that market
https://www.goodreturns.co.nz/article/976524198/heartland-rates-changes…
We welcome your comments below. If you are not already registered, please register to comment
Remember we welcome robust, respectful and insightful debate. We don't welcome abusive or defamatory comments and will de-register those repeatedly making such comments. Our current comment policy is here.