Content supplied by Forsyth Barr
The following is a summary of the key events impacting fixed income markets over the past week.
The local market will likely have one eye on the Richter scale this week as well as the RBNZ 2yr inflation expectation survey. The RBNZ is still very much focussed on inflation and is conscious of the outlook given the strong economic indicators present.
Quake fails to shake swap rates
The recent run of earthquakes in central New Zealand initially sent swap rates and the NZD lower, however the move was short-lived with swaps opening the week +3bp to +7bp higher across the curve.
The long-end of the curve continues to follow its US counterpart and its sell-off last week saw the New Zealand yield curve steepen by +14bp to 148bp. We may see the curve continue to steepen slightly until the RBNZ signals its intentions clearly.
September may well hold the key, with the RBNZ releasing its Monetary Policy Statement (MPS) on 12 September and the Fed holding its policy meeting just six days later. The market consensus is that September’s FOMC meeting will bring the start of the tapering and monthly purchases will be cut by US$10bn to US$75bn. Depending on what the RBNZ announces in its MPS six days earlier, we may see some change in the shape of the yield curve.
If the RBNZ is hawkish and the Fed announces some form of tapering then the slope of the yield curve may remain unchanged as the short and long-end could move in unison. Similarly, a hawkish RBNZ and bearish Fed may see a flattening of the New Zealand yield curve.
‘Taper talk’ continues to dominate
We have heard about ‘tapering’ for some considerable time and the Fed appears to be providing enough hints to the market in an attempt to smooth any market disruptions when tapering occurs.
Last week we had Richard Fisher (President of the Federal Reserve Bank of Dallas) who stated, “The economy is improving. We’re seeing better numbers in the economy. You would expect to see a steepening of the yield curve.”
As we have published many times, the long-end of the New Zealand curve is highly correlated to US long-end. Fisher’s comments were significant given he has been one of the biggest hawks and will become a Fed voting member in 2014. As a result, 10-year US Treasury yields hit a two-year high of 2.86%.
Credit market wider
The yield on the ANZ Investment Grade Bond Index reached its highest level since early 2012, rising to 4.91% before closing the week at 4.85%. Credit markets offshore performed in a similar fashion with the US market +6bp wider and European and Australian credit markets +3bp and +1bp wider respectively.
NZGB’s still in demand but foreign holders exit
The New Zealand Debt Management Office sold NZ$300m of 15 April 2020 New Zealand Government Bonds last week. The tender received NZ$815m worth of bids which saw the bonds sold at a weighted average yield of 4.35%.
RBNZ inflation expectation 2 years out is due on Tuesday 20 August.
10-year swap rate hits 5.00%
We are continuing to see the market price in higher interest rates in a years’ time. We will not get an official update from the RBNZ until 12 September when the central bank releases its Monetary Policy Statement. The move higher has been a gradual process with the 10 year swap rate now at its highest level since 3 August 2011 and +1.47% higher than its all-time low of 3.53% in October 2012. However, we are still a long way off the long-run average of 6.53%.
For bond investors; the news of higher interest rates is both good and bad. The good news for bond investors is that any new issues (if there is any of course) should see higher coupons than recent issues. However, higher coupons are not guaranteed given credit spreads continue to narrow as the ‘feel good’ factor filters back through businesses and investors’ alike.
Short-end forecast to catch up in 2014
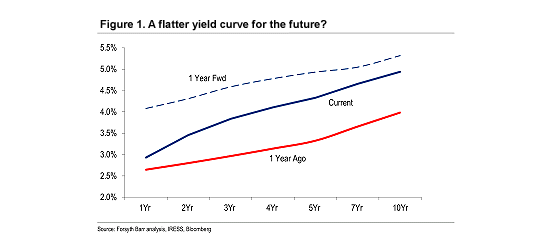
Figure 1 below highlights the impact that the RBNZ is likely to have should it begin to raise the OCR. At present the long-end of the curve remains heavily influenced by offshore events, in particular the US.
With the RBNZ expected to leap into action in March 2014, the 1-year swap rate is currently expected to be 1.15% higher than it is now with the 10-year only 0.38% higher. This means the yield curve (10 year less 2 year) will flatten by around 0.48% by August 2014.
The yield curve shape from a year ago looks relatively identical to the forecast yield curve in one years’ time. What would this mean for a bond portfolio? A simple way to calculate the impact of moving interest rates is via duration.
3-year bond portfolio duration is ideal A bond portfolio duration of say 3.0yrs means that for a 100bp (1.00%) change in the yield for each of the bonds in a portfolio, the market value of the portfolio will change by approximately 3.0%. Keep in mind, the yield for each of the bonds must change by 100bp for the duration measure to be useful. In other words there must be a parallel shift in the yield curve.
Investors are fortunate in Australisia to have a number of floating rate securities (especially common in the Australian market) and securities that have their coupons/dividends reset annual or on a three year cycle. These types of instruments can help insulate a bond portfolio from the impact of rising interest rates and can also help shorten the duration.

Corporate / Credit news
ANZ (Australia) provided a trading update for the nine months to 30 June 2013. ANZ’s statutory profit increased by +7% to A$4.7bn. The group’s net interest margin narrowed by -2bp as deposits increased by +12% and lending rose +8%. In New Zealand, ANZ was pleased with its transition into one brand.
APN News & Media (APM010) reported its 2013 interim results for the six months to 30 June 2013. EBITDA fell -4% with NPAT rising A$1m to A$16.2m. APN’s radio network performed well however overall trading conditions remain tough with possible divestments options being evaluated for brandsExclusive. APN had ~A$170m of undrawn credit facilities at 30 June 2013 and its key bond covenant, Net debt / Senior debt is 3.1x, comfortably under the 4.0x limit.
ASB posted another record result for the year ended 30 June 2013. ASB’s NZ$705m NPAT was +3% higher than the pcp with net interest margin rising +9bp to 2.25%. ASB also managed to grow both sides of its balance sheet with lending up +9% and deposits rising by +6%.
SKYCITY Entertainment Group (SKC) announced an average FY13 result, however debt levels reduced with net debt sitting at NZ$607m and an average debt maturity of 4.8 years. SKC believe they have enough facilities (or potential facilities) to be able to fund their two big projects in Auckland and Adelaide.
The RBNZ released its submissions to its consultation paper on loan-to-value restrictions. Whilst no specific details were given in the sense of limits, the examples used were loans with LVR’s of >80% would be restricted to 12% of a banks’ new lending. Interestingly, some banks’ said they would struggle to comply even if it ceased all new approvals of high LVR lending. This would suggest there are a number of high LVR approvals out there in the market place.
Transpower (TRP) released its FY13 financial results with profit from continuing operations rising from NZ$78.6m in FY12 to NZ$197.4m primarily down to the sale of one of its business units. The debt levels continue to increase rising from NZ$2,318.5m in FY12 to NZ$2,937.2m in FY13.
---------------------------------------------------------------------------------------------------
Disclosures and Disclaimers:
Disclosure: The comments in this publication are for general information purposes only. This publication is not intended to constitute investment advice under the Securities Markets Act 1988. If you wish to receive specific investment advice, please contact your Investment Advisor. Forsyth Barr Limited and its related companies (and their respective officers, agents and employees) may own or have an interest in securities or other products referred to in this publication, and may be directors or officers of, or provide investment banking services to, the issuer of those securities or products, and may receive fees for acting in any such capacity in relation to that issuer. Further, they may buy or sell securities as principal or agent, and as such may undertake transactions that are not consistent with any recommendations contained in this publication. Forsyth Barr Limited and its related companies (and their respective officers, agents and employees) confirms no inducement has been accepted from the researched/recommended entity, whether pecuniary or otherwise, in connection with making any recommendation contained in this publication or on our website.
Analyst Disclosure Statement: In preparing this publication the analyst(s) may or may not have a threshold interest in the securities mentioned in this publication. A threshold interest is defined as being a holder of more than $50,000 or 1% of the securities on issue, whichever is the lesser. In preparing this publication non-financial assistance may have been provided by the entity being researched. A disclosure statement is available on request and is free of charge.
Disclaimer: This publication has been prepared in good faith based on information obtained from sources believed to be reliable and accurate. However, that information has not been independently verified or investigated by Forsyth Barr Limited. Accordingly, Forsyth Barr Limited: (a) does not make any representation or warranty (express or implied) that the information is accurate, complete or current; and (b) excludes and disclaims (to the maximum extent permitted by law) any liability for any loss which may be incurred by any person as a result of that information being inaccurate or incomplete in any way or for any reason. The information, analyses and recommendations contained in this publication are confidential to the intended recipients and are statements of opinion only. They have been prepared for general information purposes and whilst every care has been taken in their preparation, no warranty or representation is given (express or implied) as to their accuracy or completeness. Nothing in this publication should be construed as a solicitation to buy or sell any security or other product, or to engage in or refrain from doing so or engaging in any other transaction. This publication should not be used as a substitute for specific advice. This publication is intended to provide general securities advice only, and has been prepared without taking account of your objectives, financial situation or needs, and therefore prior to acting on any information, analysis or recommendation contained in this publication, you should seek advice from your usual Investment Advisor. Forsyth Barr Limited and its related companies (and their respective officers, agents and employees) will not be liable for any loss whatsoever suffered by any person relying upon any such information, analysis or recommendation. This publication is not intended to be distributed or made available to any person in any jurisdiction where doing so would constitute a breach of any applicable laws or regulations.
We welcome your comments below. If you are not already registered, please register to comment
Remember we welcome robust, respectful and insightful debate. We don't welcome abusive or defamatory comments and will de-register those repeatedly making such comments. Our current comment policy is here.