

By Gareth Vaughan
New Zealand's clean, green overseas sales pitch has come under fire over the past couple of years. Perhaps a variation on it could be 'clean, green and neck deep in debt.'
A report from the London-based Lafferty Group, which describes itself as a provider of advanced knowledge services to the financial industry, shows the New Zealand consumer finance market with one of the highest levels of indebtedness in the world, leveraged, surprise, surprise, heavily on residential mortgages.
Lafferty's report has New Zealand's total consumer credit to personal disposable income ratio at the end of 2013 at 164%. Lafferty figures for a range of other countries have just Canada ahead of this at 166%. Australia was at 145%.
Interest.co.nz calculations put New Zealand's ratio, based on the Reserve Bank's total household claims (debt) and Statistics NZ's household income figures, slightly higher by the end of March this year at 165%.
Meanwhile, Lafferty's figures on credit card penetration have New Zealand lagging the leaders with 83 per 100 adults. On this score Japan leads the way at 292 credit cards per 100 adults, followed by South Korea with 277, Canada at 267, and the US at 228.
By Lafferty's estimates there are about three million credit cards and eight million debit cards in the New Zealand market, reflecting a high penetration level of payment cards.
"(New Zealand) payment cards usage has increased in recent years, boosted by loyalty programmes and growth in online shopping," says Lafferty.
The table below is based on Lafferty's data.
| Country |
Credit cards per 100 adults |
Indebtedness ratio |
| New Zealand | 83 | 164% |
| United States | 228 | 100% |
| Canada | 267 | 166% |
| United Kingdom | 104 | 136% |
| Australia | 80 | 145% |
| Brazil | 142 | 42% |
| Japan | 292 | 47% |
| Mexico | 34 | 10% |
| South Korea | 277 | 123% |
| Spain | 102 | 87% |
| Turkey | 112 | 55% |
House prices out of whack with incomes
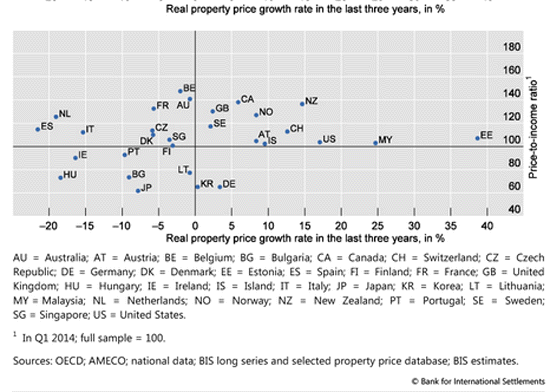
Separately, a recent chart from the Bank for International Settlements (BIS), the central bank's bank, shows a New Zealand house prices to disposable income ratio at almost 140%, one of the highest levels from a range of countries surveyed. A value of 140 indicates the current ratio is 40% higher than the historical average.
"The vertical axis in the bottom panel shows the most recent value of the affordability benchmark: the ratio of prices to disposable income per capita, rebased using its historical average. The graph suggests that for most countries the current ratio is not too far from this benchmark, suggesting that prices have not diverged dramatically from income trends," BIS says.
"For a number of countries, however, current property prices are at least one fifth higher than those implied by the historical relationship to incomes, suggesting potential downward pressures on real house prices. This might lead to a reversal or moderation of recent growth, eg in Canada, or a further sliding of prices, eg in Belgium and France. This argument would be more compelling for markets where prices have grown rapidly in the recent past, and where income growth is projected to be rather moderate," adds BIS.
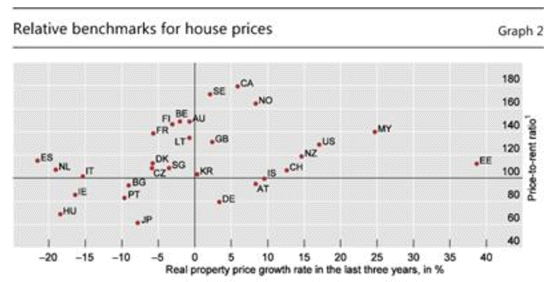
Meanwhile, BIS' house price to rent ratio chart (below) has New Zealand at 120%, suggesting the current ratio is 20% higher than the historical average.
This story was first published in our email for paying subscribers. See here for more details and how to subscribe.
33 Comments
Not for the local populous who would still like to buy a house. If a country is going to run a massive immigration program it needs land development rules to match.
It was interesting to read about 24 year old Rebecca in the New Zealand Herald and how she had had 4 overseas holidays this year and so many of her friends were travelling or wanting to travel to Europe. It would be interesting to know whether she owns her own home or if she does own one how much debt she has on it. I have been regularly attacked on this site for suggesting many of the X and Y generations live for now and do not save like the Boomers. I rest my case.
... interest-free student loan !
Gordon, you are an uninformed old so and so. However, if there was an article in the herald about you I would not assume all people your age are uninformed old so and so's.
I note you attack me personally and not my comment Zp. I can only presume you have no thoughts to contribute. Are you of the X and Y generations who expect to live like their parents without the years of hard work and saving. For the record. I am not old. I am 59 , retired and I contribute to the community by being a school trustee. I keep fit and like Rebecca I have had four overseas trips this year. Next year being the big 60 I intend to spend 6 weeks in Europe. That will be paid for from savings not a credit card or bank loan. What has changed so much that young couples do not try to pay their house debt off first then have some fun. Why keep the Bank who is really just your landlord so happy by taking your time to pay off debt.
Gordon, I have read a number of your posts and a number a well reasoned replies which you ignore.
You may well be right that Gen X and Y save less and/or have more credit card debt than the boomer generation however that is a seperate issue to housing affordability. Houses are vastly less affordable relative to incomes than they were for older generations. You continually bemoan 20% interest rates yet fail to acknowledge how much smaller the debt was back then or the 20%+ house price inflation that went along with it.
If you'd like a reasoned debate about housing ability I'm all for it - but all I see from you are attacks on the younger generation which grow tiresome.
For the record - I am a Gen Y kiwi - I live overseas and am fortunate to be paid very well in my job. I have no debt, save almost everything I earn and hope to return to NZ one day and buy a house (and no not starting on the northern slopes of remuera). It's those less fortunate than me that I worry about.
I am completely surrounded by X and Y. They are all fantastic savers. No daily coffees, cafe meals, smart phones,overseas trips, no purchases of clothes, appliances and accessories, no purchase of boy racer cars and the costs of doing them up. They teach us boomers a lot. Luckily for a lot of them their parents will prop them up before and after they die. Their parents lived in harder times and learnt to work hard and save from their own parents who had it even harder. They endured the depression and World War Two times.
C'mon gordon - I think you need a different prism
I'm a gray-hair myself and I think zombie-ponzi is quite right - in this case
Answer this
That 24 year-old woman who has had 4 overseas holidays this year, what sort of job do you think she is working at that would allow her to take time off 4 times in less than 8 months? Not many
What sort of personal-family circumstances do you think are backing her that allow her to do that?
She is not an exception and she admits that in her interview. X and Y view overseas travel quite differently from prior generations. Not something you do when you retire. Not something you save up for. They expect it and will borrow for it. I am not saying any particular generation is right. They live for now, expect it now and bugger the cost. They could be right in their thinking. But don't moan when they think about buying the first home and get told they need to save more.
The OE is quite common - especially amongst women, who figure they'll get some nice job when they get back - got to have your gap year to get some experience... you know they "deserve it".
Seriously though, such privilege has always been considered an entitlement by the well-to-do, with someone elses money to spend
We don't know how long she was away, or who paid.
I figured it's the same sort of personal-family circumstance which let that kind of person complain about farmers not paying to fix environmental issues, complaining about the cost of groceries, and telling farm folk they get paid too much ... when I can't pay for overseas holidays...I can't even get the last 3 days annual leave (including a saturday) without being called back to work every day....
"What has changed so much that young couples do not try to pay their house debt off first then have some fun"
Could be that they will either be too dead or too decrepit by the time the house is paid off?
Anyway, the simplest yardstick of whether or not houses are harder to buy nowadays than in ours, is how many years income does it take to buy one. Absolutely nothing else counts, at all
It is only a plentiful land as long as we do not overpopulate it. I wonder if you come from somewhere that thinks this country needs spoiling with overpopulation like so many others. I do not
From another place ?????
Nickname says it all - who wear coolie hats ???
Good lord, you're still drifting along in complacent ignorance and failing to distinguish between anecdotal and big picture hard data? Are you completely incapable of joined-up thinking?
Actually, there's something I've often wondered, and you might be just the chap to explain.
How is it possible for the Smug Boomer demographic to simultaneously gloat about how their house values have been doubling and tripling over the past fifteen years, and also believe that things are just as easy for Gen Y, despite wage stagnation and high unemployment over the same period? How is it possible to hold these positions simultaneously without your skull exploding from the cognitive dissonance?
Exactly Kakapo, Raegun and others. Hard statistics beat anecdotes and sterotypes.
Gordon what is your problem with whether this generation or that had it easier or not?
Surely the question is whether housing is over valued against its fundamental cost? The hard statistics here and elsewhere say NZ has a problem. Whether this is causing NZ as a whole to get over indebted due a limited number of houses being bidded ever higher in price?
This being a complete waste of capital that could have been put to more productive use elsewhere. So any growth this excessive housing inflation/debt promotes is like a ponzi scheme -false and not sustainable.
Maybe Gordon you don't like these questions? Are they too scary and you cannot face them so as a distraction to yourself you blame someone else?
Brendon you only have to talk to retailers and you will find out how tough it is for them. New Zealand has too much personal debt fall stop. Hire purchase , credit cards and house /farm debt. No wonder our big farms are being bought by foreigners as we are not great savers as a nation.
So retailers are doing it tough and not moving the goods, but hire purchase and credit card debt are too high. Isn't this an interestingly contradictory dilemma.
Not even slightly contradictory. That is one reason big box movers have been doing well because they have vertical integration with finance companies. This situation was highlighted about 20 years ago when the credit rules were eased up (before then there were many more rules, like you couldn't use a credit card to pay for groceries or other ongoing essential - the retailer was not permitted to accept it under NZ law).
The anecdote was that smaller outfits would find it too hard to compete with the promotion of instant gratification that would allow big box stores to move inferior products by use of easy credit, low and zero interest rates, product discounting, pure volume discounts.
Statistics were quoted that people at the time saved more money and did not want to use Hire Purchase as it was considered socially embarrassing, that statistics showed that zero and low interest rates would never be offered as finance companies could afford to operate that way and no big store would be willing to wait 3 - 5 years for payment as the risk was too high on default, and that Credit Card interest rates were high enough to discourage general use by the majority of the public. Those were the "facts" they were the _Statistics_ we got quoted in our faces....
Shopkeepers knew the market, not the numbers in the rear vision mirror.
Were before you had to tuck away $20 a week for a stereo, which took about a year to get, and that's with a 10% cash discount....
Now the finance cost is part of the sales, so no cash discount, put $200 down from one weeks pay, and it's in your home, no waiting. Short of cash for payments? just put on one of many credit cards vying for your money. After all it's not like the criteria for application are as heavy as they used to be.
And then there are comments like this one from Kakapo, "Ed."
Or is this just "one rule for me"
What'd I do?
I just got hauled up (and deleted) for critising an opinion on the "spruikers advert" thread.
Apparently by asking the original author to quote the property he claimed was being sold, and asking if he were just trying to get extra airtime for the advert, was count as personal abuse.
I was way nicer than the roasting you're trying to hand to gordon (and directly at gordon personally).
Can't go ruffling the feathers of the advertisers. Whereas us riff-raff below the line have to expect a bit of rough-and-tumble.
I dont find that as acceptable.
the advertisers are paying for what?
Us.
they should be the opnes putting up - especially if they fail the public credibility test... if the advertisers can put forward something dodgy..then what does that say about those who endorse (publish) such things
I don't find it acceptable either. Cowardly, dishonest, double standard, hypocritical are all words that spring to mind. But I strongly suspect that that's the underlying policy.
My housing interest rate was only 21`% GBH. If I had a student loan I would have paid it off a lot quicker than they actually do today. Too busy travelling and not willing to wait. " I want it now and I deserve it."
Also morale hazard - if I have nothing someone will support me if I'm young and pretty, the system is there for Me
Gordon, i did the sensible thing - finished university, stayed in NZ, set up my first business... all while my friends travelled on their big OE.
And to this day I regret that decision.
As it turned out, I didn't make any money until my late twenties, early thirties anyway. Almost no one does. There is time to travel and see the world before settling into the grind - at least that's what i think.
same here - and since I ran into problems, I'm now 45 and still tied to the wheel (and thus warning others off it).
Go to uni and study hard, don't be distracted they said. ended up with out the social skills expected to prosper in that environment. This held true afterwards where people expect certain social/shareable experiences - not "good attitude and determination" like the job seek crew kept saying.
I studied till I was 27 then put my head down as I had nothing Triple. Meantime my two younger brothers who are accountants went overseas for long OE's. I did not travel overseas until I was 42. Do I have any regrets? No as luckily I have survived 30 years of hard work with my health intact notwithstanding the stress and now I can enjoy being able to travel whenever I want to and not worry about how much it costs. Probably like you I did not make any decent income until my mid to late thirties but that was when the real saving started. Unless you were born with a silver spoon in your mouth( and I wasn't) you have to save some money at some stage in your life and for a reasonable period of time otherwise you will have to carry on working when you would rather be retired.
Daughter has not long come back from her OE, fresh out of Uni there were few jobs in her field last year so she went and has come back to exactly the job she wanted. She went to a bank to see about a personal loan, $3k for a year, covering some set up costs etc. Finance rate of 38%, 25% interest plus costs. Needless to say she chose to make do with $4 for the next week plus turns out the new job comes with unexpected pay days so all good.
But I'm totaly stumped by the loan offer and after saying no they bugged her with three phone calls and were wanting her to take $10k. No wonder we have a debt problem.
Everything is a cycle and we're at the end of our own commodity boom just like Australia is, as China is slowing drastically and may even now be in recession (but we won't know as the world's best manufacturer is the world's best at manufacturing data). Unfortunately we have squandered our own boom, continuing to leverage up when we should have been paying debt down. The data in the article on household debt is right and the day of reckoning is pretty close for house prices. The US imploded when their household debt to disposable income hit around d 128% and we are clear through this level. What is currently saving us is low interest rates. But these are nearly at an end. US rate rises early next year will cause the nzd to fall further introducing inflation pressure. So our long term mortgage rates and short term rates will rise as the economy slows rapidly. Hold tight for a bumpy ride.
I agree,
It's just a matter of a good global shake (coming soon, especially for commodity exporters) to end the -"house prices never go down", "if you don't buy now you will not be able to buy later", "buying is always a good investment if you can afford the mortgage", etc. -mentality that I listent to everyday when I try to justify why I keep renting despite having a good permanent employment. But it's not easy to explain to some that the longest term investment in a person's life might also be a risky one.
As soon as people start seeing NZ houses for what they are - an overpriced overheated unjustified market generally of a very poor quality (bad materials, no insulation, no energy efficient, far from workplaces)- panic will drive prices down.
What concerns me is the effect that will have in the overall economy when people start being unable to face their debts despite selling their properties (as they would be sold for a much lower price). Will then taxpayers "rescue" the system and those who are indebted? Will a massive inflation occur to help the hugely indebted population rewarding those who participated in this irrational market?
I hope OCR returns to a safer number soon to prevent long-term damage..
We welcome your comments below. If you are not already registered, please register to comment
Remember we welcome robust, respectful and insightful debate. We don't welcome abusive or defamatory comments and will de-register those repeatedly making such comments. Our current comment policy is here.