
By David Scobie*

It’s hard to believe that a decade has passed since the whistle blew to kick-off KiwiSaver as a savings vehicle in New Zealand. Now over $40 billion in size and boasting 2.8 million enlisted fans, the scheme has grown into a force to be reckoned with.
The returns of growth-oriented funds improved over the period, helping investors with a tolerance for risk and a longer term mindset to come out on top. This occurred amid signs of declining market volatility, albeit a continuation of that trend cannot be taken for granted.
The path of returns
For the purposes of the Mercer KiwiSaver Survey, funds are separated into universes based on (1) “default” status (most conservative other than cash) and (2) the benchmark level of exposure to growth assets. The survey is distinct in that returns are compiled on both an after-tax and after-fees basis, thereby replicating the true return experience of members (while excluding cashflows) - see survey notes at end.
The chart below shows the median return of each category universe for 12 month periods over the last decade.

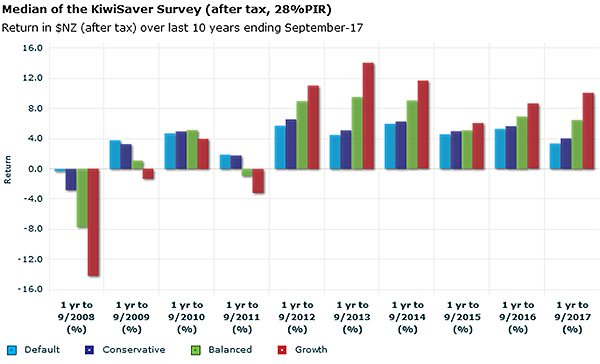
It can be seen that it was a rocky first half for growth-oriented KiwiSaver investors as the impact of the Global Financial Crisis took its toll. However, as equity markets recovered and staged a remarkably durable bull market, those funds with a higher allocation to growth assets began to perform notably better than more defensive funds. Meanwhile, fixed interest assets entered the second spell having posted a steady run of positive results - boosted by sustained falls in interest rates - before going on to lose some momentum later in the period.
Taking the 10 year period as a whole, the median return for each category universe was in a fairly tight band ranging from default at 3.9% p.a. to growth at 4.8% p.a. However, it’s helpful to note that, in practice, most members will have secured an average return above that figure. This is due to the larger account balances built up in later years - arising from compounded returns and accumulated contributions - receiving the benefit of stronger asset price performance in those later years. This was particularly the case for growth-oriented investors.
Looking at the variability of returns in the individual 12-month periods brings to mind the issue of “sequencing risk”. This is the risk of members experiencing poor investment performance at the wrong time, typically when the portfolio balance is at its greatest, resulting in less money for retirement. Two people about to retire might have made identical KiwiSaver contributions and experienced the same average returns over a 10 year period and yet have significantly different balances to retire on, all due to sequencing risk. Negative investment returns close to the time of retirement can be particularly damaging.
Sequencing risk tells us that the timing of when good or bad returns occur can be almost as important as the size of the returns. It is a risk which is apparent throughout the accumulation (and decumulation) phases of the investment cycle. While longer horizons allow a KiwiSaver member the luxury of regaining losses from a poor sequence, shorter horizons reduce this luxury.
The path of volatility
The chart below shows the median standard deviation of each category universe for 12 month periods over the last decade. Standard deviation tells us how varied a fund's returns have been over a particular timeframe, both on the upside and the downside. The more a fund's returns fluctuate from month to month, the higher its standard deviation, and this can be interpreted (to a degree) as a sign of greater risk.

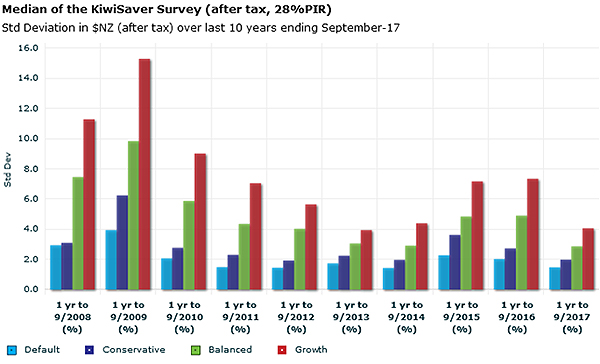
In practice, funds with modest standard deviations tend to suffer fewer losses over time than those with high standard deviations. However, it is possible to own a fund with a low standard deviation and still lose money. This can be seen with more defensive KiwiSaver funds in year 1, for instance, when looking at the two charts above.
Taking the 10 year period as a whole, the median standard deviation for each category universe was in a band ranging from default at 2.2% p.a. to growth at 8.1% p.a. As we would tend to expect over the longer term, higher standard deviation was reflected in a greater average return; more so if we were to include cashflow and compounding effects. Volatility can be more of a friend than foe for the investor with a longer time horizon.
Of note is that the 5 year standard deviation of a fund is a measure required to be stated by KiwiSaver providers for use as a “risk indicator”, intended to help investors make decisions. Given volatility is only one of many signs of potential risk, and the future pattern of volatility can differ markedly from its recent history, caution needs to be applied - the term “historical volatility indicator” may be a more appropriate label. This is particularly relevant at the present time when we have witnessed relatively subdued volatility across multiple asset classes in recent years, including for “higher growth” assets, even though these assets have significant risk embedded in them, including potentially on valuation grounds.
Investing for the seasons
When looking back over KiwiSaver’s lifespan, we can surmise that the majority of members will have had a broadly positive experience in terms of growing their savings balance. This conclusion is strengthened once the significant benefit of government and employer contributions is factored in.
While it was a fraught environment for growth-oriented investors soon after the advent of KiwiSaver, for most the game continued on. Ultimately members with the ability to tolerate volatility and exploit the benefit of time were rewarded for the extra risk taken.
Going forward, investment markets can be sure to offer new challenges, and subdued recent volatility is not a cause for complacency. However, history tells us that a greater portfolio tilt to growth assets offers a pathway for members to accrue a larger pool of retirement assets in the long-run. What counts most is the number on the savings scoreboard when the final whistle blows.
Survey Notes
- The Mercer KiwiSaver Survey contains fund returns after fees and after tax at a Prescribed Investor Rate of 28%, being the highest tax level KiwiSaver members face.
- Returns are after all fees that are asset-based being management fees, performance fees, trustee fees and other in-fund costs.
- The Survey categorises funds into universes on the following basis:
- “Default” status funds
- “Conservative” funds, being those with a weighting of 20-39% to growth assets
- “Balanced” funds, being those with a weighting of 40-60% to growth assets
- “Growth” funds, being those with a weighting of 61-100% to growth assets
- Growth assets are regarded as investments held in equities, real assets and alternatives, whilst investments in fixed interest and cash are regarded as Income assets.
- Funds with returns available since KiwiSaver’s inception represent a sub-set of the selection available today.
- Mercer is a KiwiSaver provider with fund returns included in the Survey.
*David Scobie is a Principal in Mercer’s Investments business, based in Auckland. He advises institutional clients on their investment policies, structures and fund manager selection, linking in with Mercer's global research capability.
This article does not contain investment advice relating to your particular circumstances. No investment decision should be made based on this information without first obtaining appropriate professional advice and considering your circumstances.
7 Comments
I'd like to know how much in fees we have paid over 10 years as a percentage of funds under management. Despite the massive uplift in FUM, the fee percentages, especially for active funds, have stayed fairly static.
We did a story on that, albeit it was sometime ago now. The recently released Financial Markets Authority annual KiwiSaver report says investment management fees rose $46.8 million, or 21.3%, to $266.3 million in 2017 from $219.5 million in 2016. Per member, the average investment management fee paid increased from $84.15 in 2016 to $97.82. Administration fees rose $4.6 million, or 5.9%, to $82.4 million from $77.8 million. Per member, the average administration fee paid increased from $29.84 in 2016 to $30.28. As a percentage of investment returns, investment management fees dropped 41.7% to 9.84% from 16.87%.
I am interested in the total fees as a proportion of the FUM each year. If you give an fund manager twice as much money, it does not take twice the cost to manage it so would expect to see this coming down over time
I am also curious to read the exact numbers. The returns are pretty low. I have conducted some research online, but somehow they result in mixed answers. I know their assets under Morningstar's database have significantly grown in September of 2019. Martha - Mold Removal San Diego Ca Senior Analyst
I remember that when kiwisaver was first set up that growth funds were terrible. Its hard for me to forget that.
With the regular input of new money poring into the stock market from growth funds, it adds to the bubble.
I don't think that the stock market will fall due to retirees withdrawing kwisaver money, I think that something else will cause a fall well before that time.
Why are the average return on growth funds so poor in the past 3 years. I suspect too many "growth" funds are more like balanced funds. I think there needs to be more criticism of the composition of these funds so that consumers are more information as to how they are underperforming.
Ten years and most of the time the Nats strangled it. Be good to see Labour/NZFirst/Greens give it a boost. Universal contributions, and lift the contribution rate 1% a year for the next 5 years.
It's like when is the best time to plant a fruit tree. Answer. 5 years ago.
We welcome your comments below. If you are not already registered, please register to comment
Remember we welcome robust, respectful and insightful debate. We don't welcome abusive or defamatory comments and will de-register those repeatedly making such comments. Our current comment policy is here.