

The Financial Markets Authority (FMA) has published data that reveals just how well different KiwiSaver funds are performing relative to the fees their managers are charging.
The FMA has taken the data KiwiSaver providers release through their quarterly fund updates and via the Companies Office’s Disclosure Register, and presented it in an interactive tool that will be updated every three months.
The ‘KiwiSaver Tracker’ makes it quite clear which fund managers are charging high fees, but aren’t delivering high returns, and vice versa.
The FMA’s director of external communications and investor capability, Paul Gregory, says: “Over five years, there certainly seems to be a link between higher risk investments and higher returns. However, the link between higher fees and higher returns is, apart from in the case of a couple of standout funds, far less obvious.”
This KiwiSaver graph, comparing average fees and returns after fees over the last five years, illustrates Gregory’s observation. (An interactive version of the graph can be accessed by clicking on the link above).
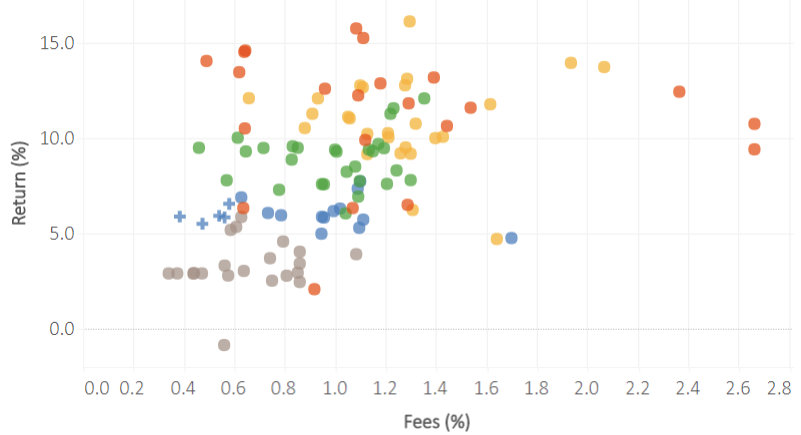

The top performing funds are growth or aggressive and have risk ratings of four out of seven - seven being the most risky. With the exception of two high risk SuperLife funds, all the funds with the lowest returns have risk ratings of one or two.
There’s less of a correlation when looking at fees versus performance. The fees charged by the top eight performing funds range from 0.5% to 2.1%.
In fact, with fees of 0.5%, the fifth highest performing fund (SmartKiwi Growth), is among the handful at the lowest end of the fees spectrum.
The two funds (Lifestages Growth Portfolio and NZ Funds Growth Strategy) with by far the highest fees, at 2.7%, have fairly similar returns to the other funds in their fund type category.
The two funds that stand out for having relatively high fees but poor performance are NZ Funds’ Inflation Strategy fund and Lifestages’ Capital Stable Portfolio fund.
Both the Lifestages funds mentioned here were closed in April last year, as its manager, Funds Administration New Zealand (a subsidiary of SBS), has launched a new range of products with lower fees.
Best and worst performers
Here is a list of funds that have had the highest and lowest returns (after fees) on average over the last five years.
The grey shaded boxes highlight the funds that have produced the lowest returns in their fund type categories, but have charged fees either equivalent to, or higher than, the funds that have produced the highest returns in their categories.
| Fund | Return after fees (%) | Fees (%) | Fess as a % of returns |
| Default winners | |||
| Superlife Overseas Non-Government Bonds | 5.9 | 0.6 | 9.7 |
| Superlife Overseas Bonds | 5.3 | 0.6 | 10.2 |
| Default losers | |||
| SuperLife UK Cash | -0.9 | 0.6 | - |
| Aon ANZ Cash | 2.4 | 0.9 | 26.1 |
| Conservative winners | |||
| Aon Russell LifePoints Target Date 2015 | 7.7 | 1.1 | 12.4 |
| Aon Russell LifePoint Conservative | 7.4 | 1.1 | 12.9 |
| Conservative losers | |||
| Lifestages Capital Stable Portfolio | 4.8 | 1.7 | 26.4 |
| AMP Conservative | 5.0 | 0.9 | 16.0 |
| Balanced winners | |||
| Milford Balanced | 12.1 | 1.4 | 10.1 |
| Aon Russell LifePoints Target Date 2035 | 11.6 | 1.2 | 9.6 |
| Balanced losers | |||
| AMP Moderate | 6.1 | 1.0 | 14.7 |
| AMP Moderate Balanced | 6.9 | 1.1 | 13.6 |
| Growth winners | |||
| QuayStreet New Zealand Equity | 16.2 | 1.3 | 7.4 |
| Milford Active Growth | 14.0 | 1.9 | 12.2 |
| Growth losers | |||
| NZ Funds Inflation Strategy | 4.7 | 1.6 | 25.9 |
| QuayStreet Australian Equity | 6.2 | 1.3 | 17.4 |
| Aggressive winners | |||
| OneAnswer Australasian Shares | 15.8 | 1.1 | 6.4 |
| OneAnswer International Shares | 15.3 | 1.1 | 6.8 |
| Aggressive losers | |||
| Superlife GEMINO | 2.1 | 0.9 | 30.8 |
| Superlife Emerging Markets | 6.3 | 1.1 | 14.5 |
Note there are a number of new funds, like those of Simplicity, which haven’t been around for five years, so haven’t been included in this comparison. The KiwiSaver Tracker allows you to compare funds based on returns over a year, but interest.co.nz hasn’t focused on this, as performance can fluctuate dramatically over a year.
What about the banks?
While the major banks have usurped the bulk of KiwiSaver investors, their funds haven’t stood out for being particularly strong or weak performers.
Banks’ funds generally sit in the middle of the pack in terms of net returns across the various fund types. Their fees are also at the lower end of the spectrum.
In contrast, smaller providers such as Aon, Funds Administration New Zealand, Booster, Quay Street and NZ Funds, have higher fees as a proportion of returns.
ANZ’s general manager of wealth products and marketing, Ana-Marie Lockyer, says ANZ has already cut its fees across its funds by about 20% since 2009.
She says ANZ is “starting to deliver some economies of scale to members”, but it is not yet at a point where it can reduce fees. She says this would see a reduction in much-needed investment aimed at educating investors and making advice accessible.
Are actively managed fund managers getting a raw deal in this debate?
What the FMA’s KiwiSaver Tracker does not tell you, is how actively managed various funds are. Investors generally expect to pay higher fees for more actively managed funds, and vice versa.
While passively managed funds typically do well when the market does well (as it has in recent years), more actively managed funds are in theory supposed to soften the blows during downturns.
It is on this basis that Booster’s chief investment officer, David Beattie, points out that given KiwiSaver launched towards the end of the Global Financial Crisis, we haven’t yet seen how funds perform in a downturn where active management is supposed to show its value.
Once this happens, and KiwiSaver goes through a full market cycle, he believes we will be able to have a more realistic discussion about fees versus net returns.
“I think there is going to be some significant differences that will emerge out of that process. And we sort of have to go through that cycle to get to that point,” he says.
Are fund managers already ‘lean and mean’?
Nonetheless, asked how much room there is for Booster to drop its fees, Beattie says: “The industry is obviously growing, and growth brings capacity to be able to reduce fees over time. But we’re already running fairly lean and mean.”
In fact, Funds Administration New Zealand’s executive director, Graham Dunston, who is responsible for the Lifestages funds, believes the amount of funds providers need to have under management to have a sustainable business has increased from around $100 million to at least $500 million over the last 15 years.
He puts this largely down to an enhanced regulatory regime with necessary, but more cumbersome, compliance requirements.
“Even if you’re pursuing an outsource model [of certain services related to funds management], you still need to have an operating infrastructure that can actually manage and monitor those relationships,” he says.
As for technology - “potentially it’s an aid, but you can’t default to it. You still need someone with a hand on the tiller, making sure things are being done the way they should be.”
Are fund managers prioritising advice over fees?
Dunston says the environment “absolutely” makes it difficult for new entrants to enter the market.
However for the smaller operators, facing tough competition from banks, he believes the future lies in targeting a segment of what will become a more fragmented market.
In other words, providing niche product offerings with different asset allocations, more granular information, and advice to larger net worth individuals, while leaving the banks to the mass market.
This has happened in Australia, so he can’t see why it wouldn’t happen here.
Beattie says Booster is already placing great emphasis on advice.
“We make no apology for the fact that we’re slightly above average in terms of our fees relative to the market. Because we’ve always embedded an element of access to financial advice in our fund offerings,” he says.
“Of the fee that we collect, we typically pay advisers up to 0.5% on an ongoing basis, in order for that member or KiwiSaver client to have access to an adviser. When you multiply, 0.5% times an average KiwiSaver balance of let’s say $20,000, that’s $100 a year that someone’s effectively paying to have access to someone to talk to.”
We welcome your comments below. If you are not already registered, please register to comment
Remember we welcome robust, respectful and insightful debate. We don't welcome abusive or defamatory comments and will de-register those repeatedly making such comments. Our current comment policy is here.