

Despite the fact that our mortgage debt is rising at the pace of more than 6% per year, the amount of interest we are paying is static.
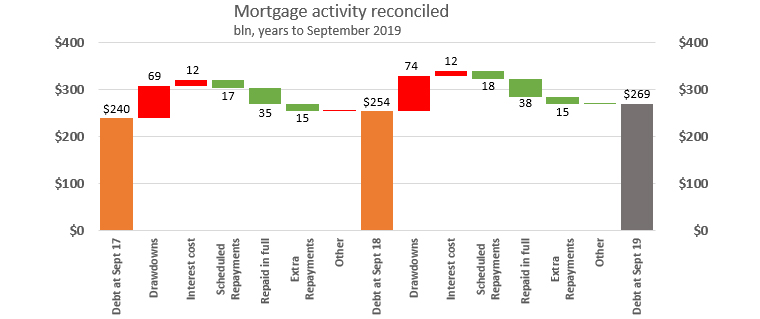
In the year to September 2019, we collectively added $15.4 billion to the bill we owe banks for housing loans, taking the overall liability to $269.4 billion
But in that same year, we paid them $11.9 billion in interest. And that compares with an unchanged $11.9 billion we paid in the previous year.
Low interest rates keep repayments low, allowing us to borrow more. I suspect the Reserve Bank thinks that low interest rates 'save' borrowers money. But borrowers aren't behaving like that.
The key driver is loan payment affordability.
And other data clearly shows that low interest rates are allowing more first home buyers into the market, even at the elevated house prices they have to pay. In fact, their buying competition is doing its part in pushing up house prices, especially in the lower quartile end of the market.
Further, Reserve Bank data collected from bank mortgage book activity also shows borrowers are still making more payments over-and-above those scheduled in their mortgage contracts.
In the year to September 2019, borrowers made $17.8 billion in principal repayments, and then added another $14.6 billion in extra principal repayments over an above the core obligations. That is a remarkable outcome, suggesting that payment stress is just not an issue.
Compare that with the year to September 2018. In that year, they also added $14.6 billion in excess payments on top of the $17.0 billion scheduled repayments. The habit of paying down quicker isn't slowing.
(This data does not include the "payment-in-full" activity that happens when an owner sells out, and these involved $37.7 billion in 2019 and $35.2 billion in the prior year.)
Knowing this data for mortgages allows us to derive what banks are doing with lending for loans other than for mortgages.
| year to June 2019 | Interest charged |
Mortgages (average) |
Other loans (average) |
Rate (average) |
| $ bln | $ bln | $ bln | % | |
| - ANZ (RBNZ Dashboard) | 6.523 | 78.536 | 51.031 | 5.03 |
| - ASB (RBNZ Dashboard) | 4.352 | 55.869 | 30.148 | 5.06 |
| - BNZ (RBNZ Dashboard) | 4.193 | 40.851 | 44.644 | 4.90 |
| - Kiwibank (RBNZ Dashboard) | 0.933 | 17.427 | 2.199 | 4.75 |
| - Westpac (RBNZ Dashboard) | 3.962 | 49.289 | 32.366 | 4.85 |
| - All others (difference) | 2.709 | 16.136 | 23.126 | 6.90 |
| Total all banks (S21 and C5) | 22.672 | 258.108 | 183.514 | 5.13 |
| Total mortgages (C35) | 11.871 | 258.108 | 4.60 | |
| All other lending (difference) | 10.801 | 183.514 | 5.89 |
"Average" bank mortgage rates of 4.6% are clearly higher than current fixed rate offers which are now well below 4%. As those new lower rates work their way through the mortgage book as fixed terms roll over, so it seems clear that the amount of interest borrowers will be paying banks is likely to hold or decline - and support rising prices that can be paid. Asset inflation, the consequence of low rates.


We welcome your comments below. If you are not already registered, please register to comment
Remember we welcome robust, respectful and insightful debate. We don't welcome abusive or defamatory comments and will de-register those repeatedly making such comments. Our current comment policy is here.