
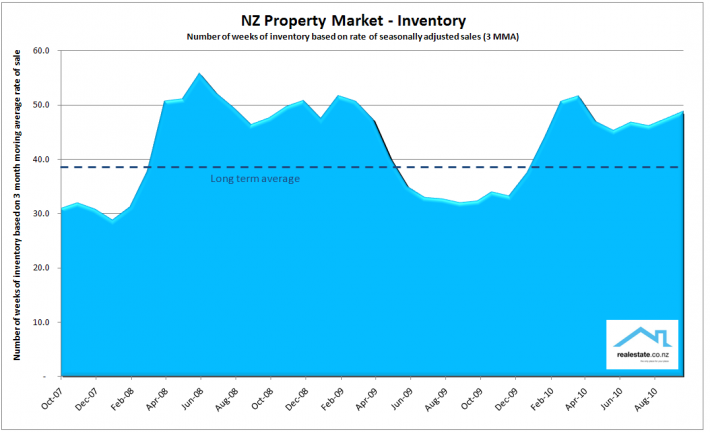
Realestate.co.nz's report for October showed 'spring passed the market by' as new listings fell in a "stagnant, buyers market that could last for months."
There were 11,911 properties listed in October, down 12.1% from the same month a year ago and 1% lower on a seasonally adjusted basis from September. The inventory of unsold houses rose to 48.8 weeks from 47.5 weeks in September and was up from 46.1 weeks a year earlier.
The data is the first from the market nationwide for October. Barfoot and Thompson will release its figures later this week, with QV to follow that and the official REINZ figures on November 12.
"New listings in October failed to provide the usual Spring lift in the property market, indicating a stagnant climate that could last for months," Realestate.co.nz said in releasing the report, which is available in full at unconditional.co.nz.
The combined total of properties listed in August, September and October (the traditional Spring lift period) was 32,274, marking a 12.5% fall from the same time last year.
“If property hasn’t listed by now, it’s unlikely that it will before the Christmas period," Alistair Helm, CEO of Realestate.co.nz said.
"With sales slow and listings not coming on, the market clearly reached a plateau in October, and it’s not getting any better. At this point it’s fair to say that Spring has passed us by,” Helm said.
The sluggish sales activity is failing to eat into the high number of unsold houses nationwide, he added.
"Based on these inventory levels, New Zealand remains a buyer’s market," he said.
"The overriding issue in the market is the level of unsold houses, which continues to offer buyers choice, but is challenging for sellers competing with so many alternative properties. The theoretical impasse to this situation would normally be a weakening of prices. This is certainly not shown by the latest month’s expectation of asking price which rose again."
The truncated mean asking price for property listed in October rose to NZ$420,451 from NZ$411,745 in September and NZ$403,423 in October a year ago.
"The key factor in the market continues to be the level of sales which is the reason for the significant high levels of unsold houses on the market, which is now edging ever closer to a full 12 months worth. Sales over the past 4 months have been stuck within a very tight range of 4,300 to 4,400 with no appreciable seasonal movement," Realestate.co.nz said.
"These sales levels are very comparable with the same period in 2008 when this situation went on for over 10 months until the market saw activity as prices eased and inventory was cleared," it said.
'No need to adjust asking prices'
"In terms of asking price expectation, sellers are certainly indicating that their view is that property prices do not need to adjust, rather the opposite having seen a further rise in asking price in October. The key issue is that with the high levels of inventory the strength in asking price is counter to the market trend which was seen in 2008 when prices softened. The current asking price is now closer than ever (just 2% behind) the peak of the market back in October 2007. "
Here is more detail below from Realestate.co.nz on regional variations, lifestyle blocks and apartments. See the full report here.
Wellington listings up
The majority of the 19 regions showed overall increases with 8 showing increases of more than 5% as compared to recent 3 month average.
Particularly large growth in asking price expectation was seen in Wellington where the truncated mean asking price rose 5% to a new peak of $455,422 surpassing the prior peak in Nov 2007.
The regional perspective with regard to new listings in October shows some variations with still the majority of regions showing a year on year decline indicating the potential for these markets to be deficient in new listings and therefore potentially leading to a seller’s market.
Waikato, Canterbury listings down
Notable regions showing significant declines in new listings are Waikato, Coromandel and Bay of Plenty – however all 3 of these regions though are seeing very high levels of unsold houses. The main metro centres of Auckland and Wellington show falls of 12% in Auckland and just 2% in Wellington.
The impact of the Canterbury earthquake continues to impact the property market there with new listings down 26% an identical level to last month in some ways reflecting the fact that whilst significantly impacted, the situation has not worsened with 1,312 new listings in the region over the past month. It is very clear from the regional map of inventory levels that the property market continues to favour buyers when viewed purely from the perspective of the rate of sale as compared to the level of unsold houses on the market.
Some of these levels across the country are approaching or has reached new highs. In the month of October 4 regions posted new highs: Coromandel at 325 weeks, Northland at 181 weeks, Marlborough with 87 weeks and Waikato with 67 weeks. Set against those significant highs are the only 2 regions which are showing levels below long term average – the West Coast of the South Island and Gisborne.
The main centres of Auckland and Wellington has levels slightly above average with Wellington showing this month a significant rise to 26 weeks. The Canterbury region has risen significantly this month primarily as a function of the very low sales reporting in September as a function of the disruptive impact of the earthquake at the start of the month.
Lifestyle blocks
The level of new lifestyle listings grew again in October following strong growth in August and September. On a seasonally adjusted basis the total of 1,110 listings represented a 3% growth, as compared to October 2009 actual listings are down 4.3%. The truncated mean asking price for the new listings in October was up 11% from September to $584,912.
This also represents an 8.3% increase in asking price compared to the recent 3 month moving average.
Apartments
A total of 509 apartments were listed in October. The last 3 months has seen almost identical levels which reflects in a 7.5% seasonally adjusted decline and a 21.8% year on year decline. The truncated mean asking price fell to $356,306 in October from $362,427 in September. This level is down 5.4% as compared to October 2009. It is also the lowest price since the peak of the market at $460,734 way back in December 2007.
In the Auckland market total listings amounted to 310 down 27.1% as compared to a year ago and down 23.5% on a seasonally adjusted basis. Asking price expectation also fell from $321,845 in September to $317,283 in October, this represented a 10.6% fall from October 2009 and a down 0.9% as compared to the recent 3 month moving average. Just 4 regions showed a fall as compared to the recent average with both Gisborne and Otago posting falls of 5% or more.
We welcome your comments below. If you are not already registered, please register to comment
Remember we welcome robust, respectful and insightful debate. We don't welcome abusive or defamatory comments and will de-register those repeatedly making such comments. Our current comment policy is here.