
By David Chaston
OK. So we are having [another] Tax Working Group to review our tax system to ensure it is fair and up-to-date.
Now seems a good time to look back on the current structure and put it in a broad perspective.
How we got here, from there.
My colleague David Hargreaves has looked at the signals so far on the brief given to this Michael Cullen-led team.
And on Thursday, November 23, the OECD released its Revenue Statistics: 1960-2015 bringing an internationally comparable view of how taxes have been collected in New Zealand (see p 216 here).
That sets a neat structure and resource to do a high-level comparison.
And we can bring the OECD data up to date using the resources of Statistics NZ and the Treasury (including data released in the last Budget).
(Because this is a calendar year review and clearly 2017 has not ended yet, and full data for it won't actually be available until March 2018, we have added some estimates around the likely nominal GDP. That is why the 2017 components of the charts below are marked with an *.)
Taxes collected from our economy
Since 2010, the Government has collected about 32% of GDP in taxes, and in 2017 this will be slightly lower. That level is down from about 34% in the ten years prior.
Individuals pay most of this, either as income taxes (highly progressive - 42% of it is paid by those earning $100,000 or more), and as GST (proportional, depending on your expenditure levels). The "All other" category covers taxes like interest, dividends, petrol and for items like ACC, customs duties, and NRWT (non-resident withholding tax).
The share companies pay is rising and is now up to 4.9%, the highest in a decade. Companies pay taxes based on profitability. During recessions that can get squeezed very hard. Look at the chart below; in the late stages of the Muldoon era when there was heavy regulation and a wage and price freeze, profitability evaporated (except for those companies 'given' import licenses). It has taken decades for industry to recover the skills needed to be competitive and profitable in a globalised world.
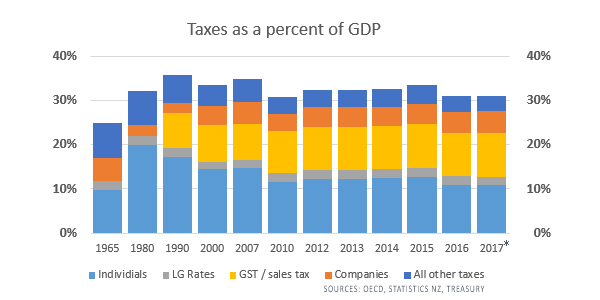
While taxes as a percent of GDP have been stable in the low 30% range, the share of each component of the total tax collected has changed steadily over time as this chart reveals.
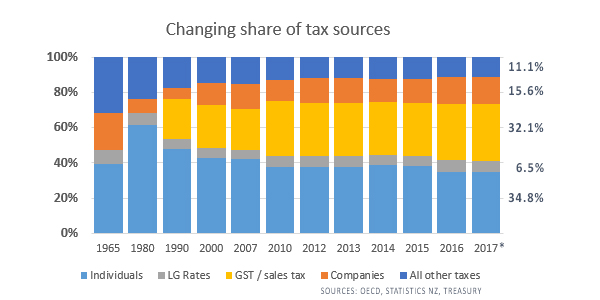
The rise in the share of taxes paid by companies is visible here as well, but the dominant change has come from GST which has risen to over 32% of all taxes collected.
Another item worth noting is the stable proportion local authority rates take of the total tax collected. However, note that this item does not include local authority fees and fines, which are included as "other" and amounted to $582 million in 2015 and $630 million by 2017.
The questions before the new Tax Working Group focus on the perceived fairness of these patterns.
How do we compare with Australia?
An obvious question about New Zealand's tax patterns is how they compare with other countries, and especially Australia.
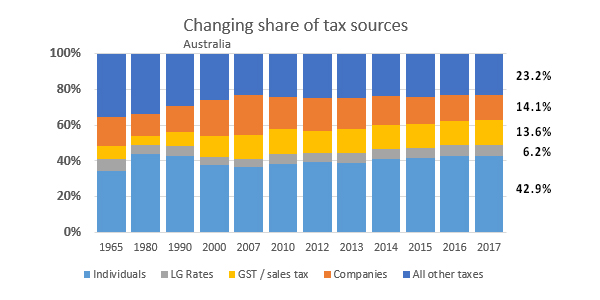
Here are the same views for Australia, based on the same data from the OECD to 2015. (The extension to 2017 is based on ABS data in their 5506.0 series.)
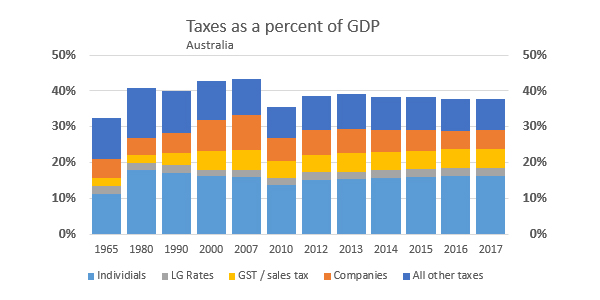
Total taxes as a share of GDP is higher in Australia at 37.7% in 2017 compared with 31.0% in New Zealand.
And the proportion paid by companies is also higher in Australia at 5.3% of GDP compared to New Zealand's 4.8%. But the proportion is clearly shrinking in Australia.
New Zealand's share is dominated by GST at 10.0% share compared to Australia's 5.1%. If there are goals to rebalance that away from the proportional GST to the progressive income tax, then the load on individuals with incomes of $100,000 or more at 42% will need to be assessed to ensure it does not drive tax minimisation behaviours from those who can afford specialist advice. That is exactly what happened when the Clark/Cullen government brought in the 39% top rate in April 2000. That actually reduced the total income tax collected as can be seen from the chart above. It also signaled the start of the drive to find less heavily taxed income from property. It is an impulse that has stayed with us.
And notice how high the Aussie taxes on "All other" are. They tax many more things in their three-level Commonwealth / State / Local structure.
Personally, I don't think the Australian benchmark is a worthy reference for the Cullen TWG review.
We welcome your comments below. If you are not already registered, please register to comment
Remember we welcome robust, respectful and insightful debate. We don't welcome abusive or defamatory comments and will de-register those repeatedly making such comments. Our current comment policy is here.