


A review of the predictions for employment growth by the economic forecasters reveals that they are pretty good as long as employment growth is about to head to around average rates; which doesn't happen very often. In general they have a poor track record of providing advance warning of major upturns and downturns.
Looking at situations where they got it badly wrong helps reveal a fundamental flaw in the approach to forecasting used by the economists.
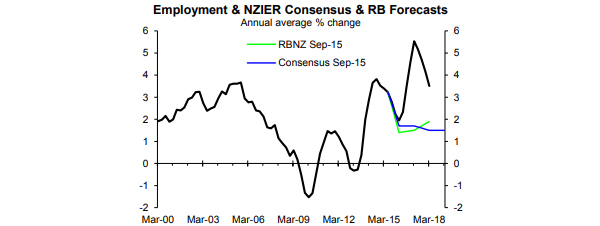
Largely in response to the large fall in dairy export prices in 2014 and 2015 the Reserve Bank, like the eight forecasters surveyed by NZIER on average, predicted weak employment growth over the next couple of years. The chart below shows the September 2015 Reserve Bank and consensus employment growth forecasts. Instead of being weak, employment growth turned out to be well above average. This example helps understand one of the shortcomings of the traditional approach to economic forecasting.
Why did the economic forecasters get it so wrong? They assumed there was a link between dairy product prices and employment growth that simply didn't exist as shown in the next chart.
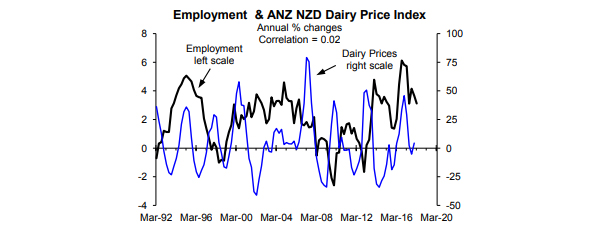
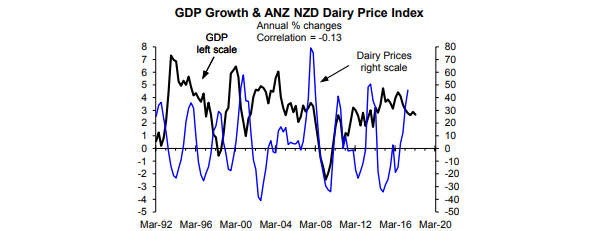
There is no correlation between the two as shown in the previous chart. Tumbles in dairy product prices are just as likely to coincide with strong employment growth as weak growth because other factors are dramatically more important drivers of employment. Equally, there is no correlation between GDP growth and dairy product price inflation as shown in the next chart. The same is true if I allow 12 months for dairy prices to impact.
The economic forecasters were happy to leap to a conclusion without checking whether it was well founded. And they were happy to torture their forecasting models to come up with weak forecasts for employment growth in response to the fall in dairy farm incomes despite there not being any historical relationship or linkage between the two.
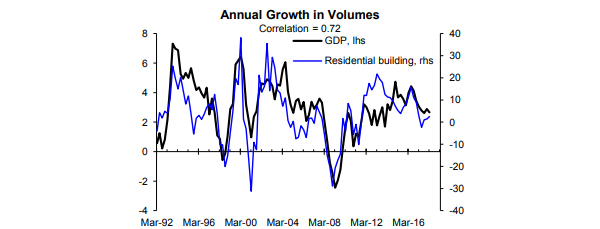
The main problem with the traditional approach to economic forecasting is that the forecasters are far too willing to plug in dubious assumptions and to ensure that their predictions match their misguided preconceptions. By contrast, following the fall in dairy farm incomes we focused on the stimulus from falling interest rates and high net migration that fuelled robust growth in residential building activity and GDP (next chart) and employment.
What use are the various employment-related surveys?
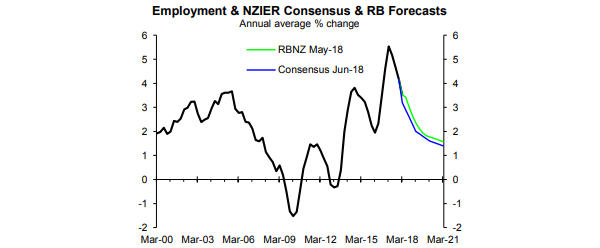
On average the seven forecasters surveyed by NZIER in June 2018, like the Reserve Bank (RB) are predicting a large, ongoing slowing in employment growth (next chart). It's no coincidence that the economic forecasters on average are predicting a similar outlook to the RB as was the case in 2015. This reflects groupthink that is much less useful than quality, independent analysis.
Predictions of weak employment growth are needed to ensure the economists don't predict the unemployment rate falling to levels that would cause a wage inflation problem. Average hourly earnings inflation has already spiked to 3.6%, but the economists are ignoring this. Too often the forecasters come up with the results they want (e.g. there won't be a wage inflation problem) and then effectively work backwards from there in coming up with predictions for employment. I saw this firsthand in my time at the Reserve Bank.
In our pay-to-view reports the focus is on the stimulus in the pipeline from the range of government initiatives that should in time underwrite a better outlook for employment growth than suggested by the chart above. However, the focus of this Raving is on how useful the leading indicators of employment are at assessing nearterm prospects. Will employment growth behave in line with the predictions in the chart above at least in the near-term?
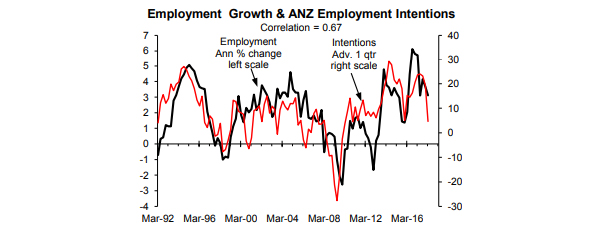
The first candidate is the ANZ employment intentions survey that at times in the past has been quite a useful indicator of near-term prospects for employment growth (next chart). At face value this survey suggests the economic forecasters are on the mark. The tumble in employment intentions points to further and significant near-term slowing in employment growth. However, the ANZ survey has been plagued by political gamesmanship since the election (e.g. this link below for the January Raving that pointed out this problem in general).
Comparing one component of the ANZ survey with a similar component from the NAB Australian business survey helps assess whether the ANZ survey has been corrupted by gamesmanship. Despite a lower NZD TWI the ANZ exporters' survey has crashed while the equivalent NAB Australian survey has spiked (two charts below).
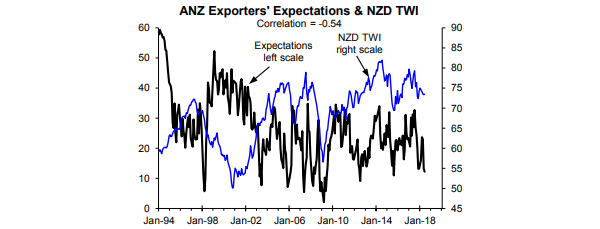
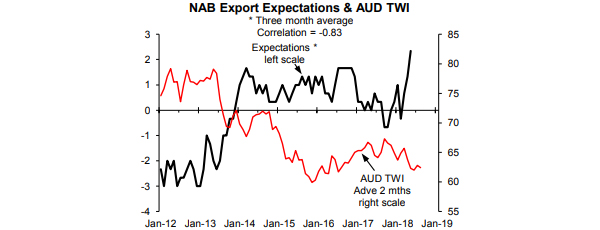
Australian exporters should be facing roughly similar global factors as NZ exporters and like NZ exporters have benefited from a lower exchange rate improving international competitiveness. The NAB survey has behaved roughly as one would expect in light of major relevant developments while the ANZ survey of exporters has gone AWOL bigtime; suggesting that things are almost as bad as they were at the peak of the financial crisis.
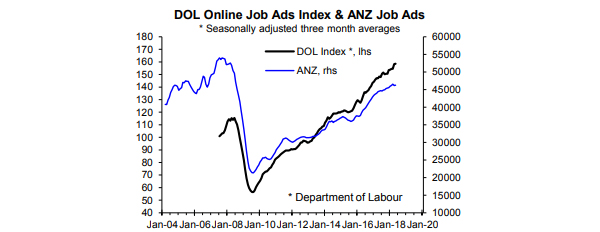
Job ads should be quite a useful leading indicator of employment growth. For a number of years ANZ has supplied data on job ads and this is one of the components in the Department of Labour (DOL) online job ads index (next chart). Somewhat strangely, they have behaved differently recently. But how useful are job ads as leading indicators of employment growth?
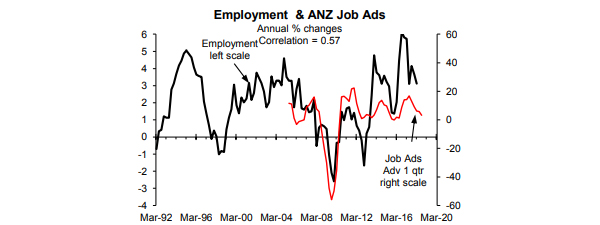
Annual growth in the ANZ job ads is a moderately useful leading indicator of near-term employment growth in terms of the direction growth is heading but since 2013 it has been a poor indicator of the rate of employment growth (next chart). The peak correlation is with growth in job ads leading employment growth by one quarter with a so-so correlation of 0.57 (1.0 maximum possible). Job ads provide a case for probably expecting a small amount of further slowing in employment growth.
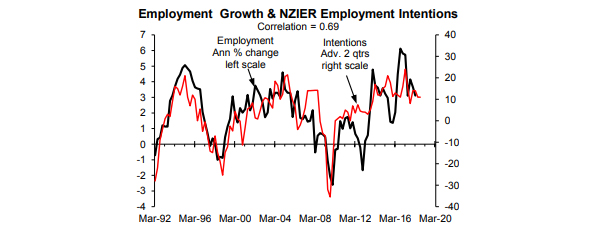
The NZIER survey of employment intentions has been a more accurate leading indicator of employment growth with the peak correlation at a moderately respectful 0.69 being with it leading by two quarters (next chart). It hasn't been overly accurate in the last several years which isn't entirely its fault (see the next page) and to the extent it is still useful it suggests little near-term change in employment growth.
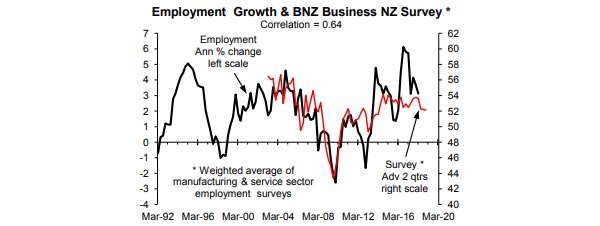
The BNZ-Business NZ survey initially offered quite a bit of promise in terms of a weighted average of the manufacturing and service sector employment surveys but since 2013 it hasn't been very useful (next chart). This partly reflects problems with the official data. The peak correlation of 0.64 is with this combined survey advanced or leading employment growth by two quarters. It suggests there could be a bit more near-term slowing in employment growth.
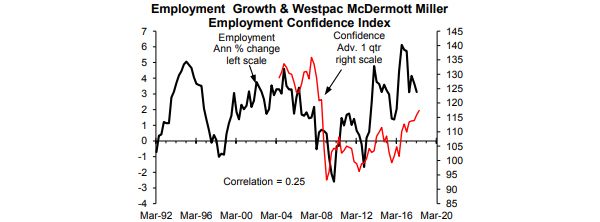
Westpac McDermott Miller release a quarterly employment conditions index that is made up of components designed to measure more than just employment prospects but the overall index is quite highly correlated with the employment-related components. Like the ANZ job ads this survey can be moderately useful in assessing whether employment growth is in the process of improving or deteriorating but it experienced a major dislocation as a result of the financial crisis that means in level terms it isn't at all useful at assessing near-term employment growth prospects (next chart). Like the overall employment conditions index, the employment-related components have also improved recently. But this survey didn't signal the latest slowdown in employment growth making us wary of the near-term improvement it predicts.
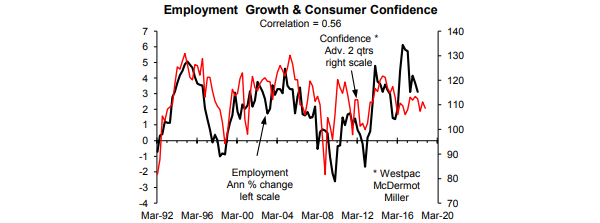
From a slightly different perspective, consumer surveys can at times be useful leading indicators of employment growth because developments in the labour market are one important factor shaping the expectations of consumers; most of whom are employees. The peak correlation is with the Westpac McDermott Miller consumer confidence survey leading annual growth in employment by two quarters but the correlation is so-so at 0.56 and there have been significant departures between what the survey has predicted and employment growth (next chart). For what it is worth, this consumer survey suggests employment growth may weaken marginally in the near-term.
There isn't a shortage of leading indicators of employment growth but none are accurate enough to have a great deal of confidence in what they are predicting for the near-term outlook. I suggest people be wary of the commentary by the people reporting the results of all the surveys in part because none have been particularly accurate in recent years; something the people writing the commentary seldom take the time to point out. In addition, such commentary will suffer from the same problems that undermine the economic forecasts (i.e. preconceptions and wishful thinking will excessively shape the commentary). However, partly in defence of the forecasters and the leading indicators, part of the problem is with the employment data that can have significant shortcomings in part because of questionable decisions made by Statistics NZ as discussed in two Ravings last year (two links below).
9 Comments
To answer Rodney's question - you should notice, but apply independent critical thinking and also be aware of commercial or philosophical bias. You should also be aware of the big questionmarks that hang over many predictive models, which usually fail to sufficiently account for real world complexity.
And....read Taleb if you are in doubt.
Sure - take in data and make your own decision. The more you do it the more your get verification how close your finger is on the pulse (i.e history shows you were right or wrong).
Economists seem a bit slow to use AI. If you plug all of this data and more into an AI engine I'm sure it will make better predictions than any economist can.
Not at all.
Neural models are well utilised in the Economics literature. However although they are typically very good nowcasting and forecasting tools, they lack interpret-ability - what many economists use as validation. Essentially although they output something that may have relatively good variance estimates, the mechanics of the output are not evident. In this context, it would imply that although a relatively more accurate estimate was made, the econometrician is unable to easily identify the marginal effects of changes in input on output parameters (or estimates).
In cases such as this (unlike forecasting spot prices, for example), maintaining the mechanical relationship is important.
Plus, neural models are nowhere near as simple as you assume them to be.
Agree you never know how the NN came to the outcome, but at least you get an unbiased outcome based off all of the input data. In this case it should be able to reasonably predict what will happen to employment growth, assuming any of the inputs have correlations, but it wont tell you how it predicted.
Amazon have done a pretty good job of simplifying neural networks - I can't say how well theirs would work though.
Interesting that the majority of the graphs use employment annual percent change as a comparator. For some odd reason, many of the comparisons start to break down as of around 2011 or so, with the employment growth increasing as compared to the other metrics after this time frame. I would instead look at unemployment, or %employed in workforce to get more valid comparisons. The employment annual percent change is strongly influenced by immigration, which picked up around 2011 or so. Many independent variables at play, attempting to smash results into only a couple independent variables, and then claiming no effect when some correlations do not fully align, is a common tyro mistake.
Agree.
For someone who worked at the Reserve Bank, Rodney seems to have a pretty poor understanding of what modelling goes on there.
Sure, the forecasts aren't good. However, out of sample forecasting is a notoriously difficult task.
Over simplifying (or misunderstanding) the modelling isn't a basis for rubbishing it.
Jobs. The cornerstone of any civilised economy.
People who work are good. People who pretend to work are not so good. People who don't want to work are lazy bludgers. Anyone who really wants to work will find work. Anyone who doesn't really want to find work will find an excuse not to work.And no amount of prophecy using human poll data will ever be perfect and the writer is right to warn the reader to add a pinch of salt.
Polls are, according to their creators, very sophisticated tools for your businesses planning ahead. They tell us that they believe what those people told them and that we should believe how they present the data (with comment).
The last time I believed anything anyone told me was 1981 and my cynicism has treated me very well since.
"Jobs. The cornerstone of any civilised economy"
I very much disagree, jobs are a fairly new concept only a bit over 100 years old, for millennia people did not rely on jobs to survive, they looked after themselves by planting, farming animals, harvesting, hunting, selling, exchanging etc... It is a fundamental difference, in that you are acutely aware that you are yourself responsible for your own survival whereas with jobs you exchange your time for a salary.
We welcome your comments below. If you are not already registered, please register to comment
Remember we welcome robust, respectful and insightful debate. We don't welcome abusive or defamatory comments and will de-register those repeatedly making such comments. Our current comment policy is here.