


Anyone vaguely familiar with how much of the official economic data are derived will have a healthy scepticism of the accuracy of the official numbers.
Too often the bank economists and media report the outcomes of the official numbers as if they are meaningful when often higher or lower than expected outcomes are the result of sampling errors/random variation.
This isn't a new problem and I normally deal with it by pointing out to clients in our pay-to-view reports when I think an outcome is a result of a sampling error or random variation rather reporting the official numbers blindly.
However, the frequency of significant revisions of the historical numbers by Statistics NZ (SNZ) has increased recently (e.g. major revisions in reported unemployment rates, quarterly GDP numbers and most recently to December quarter quarterly retail spending).
It is most likely the result of a funding problem for SNZ, just as I suspect a funding constraint was why they didn't have quality backup facilities for Infoshare - SNZ's public database - that went down for some time as a result of the November earthquake. I doubt there is a case for a political conspiracy.
But whatever the cause, my faith in the quality of the official numbers is waning. Maybe you don't think having quality economic data is a priority but I believe there is a case for one of the handouts to be delivered in the May Budget to be increased funding for SNZ subject to it being targeted at and contingent on increased quality in at least the major economic data (e.g. GDP, employment growth, unemployment rate).
The bank economists do some useful things like the email that arrived in my inbox yesterday pointing out that SNZ had revised down reported growth in retail spending volumes for the December quarter from 0.8% to 0.6% due to an error. However, just as they don't properly critique the insights provided by many of the business and other surveys, as highlighted in a previous Raving, they too readily report the official economic numbers as if they provide accurate insights. To make profitable business and investment decisions you need well-founded insights into economic prospects including critiquing of official numbers as well as of the various business and other surveys as we provide in our economic and other reports.
Major unemployment rate revisions and dubious regional data
When SNZ released the 2016 June quarter Household Labour Survey it included major downward revisions to the historical unemployment rates for the previous seven years. The blue line in the left chart shows the old unemployment rate numbers while the black line shows the revised numbers with no revisions prior to 2006. It is a major difference for policymakers including the Reserve Bank for assessing the appropriate level of interest rates if the unemployment rate is 5.7% as it was originally reported for the 2016 March quarter versus the revised 4.9% rate.
A 5.7% rate suggests there is spare capacity in the labour market meaning interest rates can, for a period, be set below the level consistent with keeping inflation low over the medium term to encourage above average economic growth that eats into the excessive stock of unemployed people. However, at 4.9% there is effectively no spare capacity in the labour market with the rate of around this level or slightly higher being effectively consistent with full employment. There will always be a percentage of people unemployed as they move from job to job or are laid off by one employer and are seeking re-employment, because of excess employees in parts of the country and a lack of mobility for such unemployed people in part because of the nature of social welfare policies and there will be an element of the unemployable people being included in the official unemployment numbers.
If SNZ had revised down all of the historical numbers there would be less of a dilemma in interpreting the data. From a monetary policy perspective it should mean that a somewhat lower level of the reported unemployment rate was consistent with keeping inflation low on average over the medium-term. But by revising down recent years significantly but not revising down earlier years it blurs the interpretation of the level of the unemployment rate that is consistent with the Reserve Bank's inflation target.
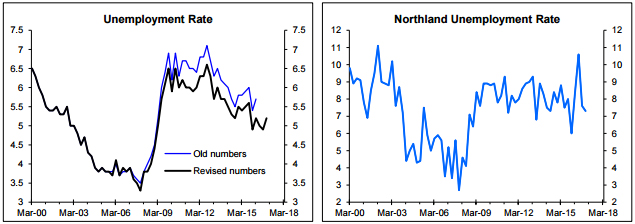
There were some good reasons why the historical numbers were revised (see this link for the media release by SNZ regarding the new methodology being used). However, the partial revision of the historical unemployment rates making me wary of interpreting the reported numbers while in addition there is the issue of significant random variation in reported unemployment rate that is visible in the left chart above: the spikes and tumbles in the old and revised numbers. It is most likely the spike in the unemployment rate reported for the 2016 December quarter reflects random variation caused by sampling errors rather than underlying upside even though most of the bank economists have interpreted it at face value because it fits with their preconceptions (as covered in a past Raving, the forecasting track record of some of the bank economists in terms of predicting the unemployment rate has been horrific recently).
Spikes and tumbles in reported unemployment rates can be dramatic at the regional level as shown in the right chart above for the Northland unemployment rate. While the national numbers in the left chart above are seasonally adjusted the regional numbers are not so a small amount of the variation may reflect seasonal factors impacting on the labour market. However, even allowing for seasonal factors there is no way the Northland unemployment rate was 6% in the 2015 December quarter, spiked to 10.6% in the 2016 June quarter and fell back to 7.3% in the 2016 December quarter as reported by SNZ. The quality is so bad the media shouldn't report the regional unemployment rates but this doesn't stop them from doing so.
The Household Labour Force numbers are based on a survey of people around the country with people included in the survey for a period. For three consecutive quarters some years ago my household was included which was the original basis of my scepticism of the data. Contact was via someone ringing my home during the working week. In the first quarter my then teenage daughter was at home and she was asked to provide information about all members of the household which at the time consisted of her, her younger brother and me. In the second quarter my son was home and was asked to provide information on all members of the household. For whatever reason I happened to be at home when the surveyor called the third time. You can imagine the huge range of answers provided by the three people surveyed in my household regarding hours of work etc. for all members of the household. Especially at the regional level but also at the national level there is major random variation or sampling error in the reported unemployment rates most likely in part because of the way the survey is undertaken.
The reality is that many official numbers are based on surveys that may or may not provide quality insights into what is happening from month-to-month or quarter-to-quarter. Knowing this I have long been sceptical of reading too much into reported monthly and quarterly numbers and instead focus on the key drivers and what should result from them, backed up by quality analysis of the leading indicators and checking what is going on at the coalface in part with the aid of contacts around the country and in many industries.
Did employment really grow 6% last year?!
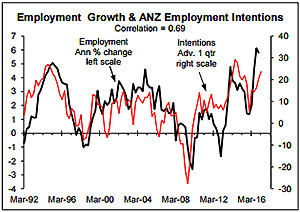
But this isn't the first time the reported employment growth has been well off the mark. There is no way that employment fell 1.7% in 2012 as reported by SNZ. Thankfully some surveys are useful indicators of employment growth like the ANZ survey of employment intentions although many of the surveys released regarding the labour market are poor or extremely poor indicators of employment growth but still get reported by the media and at times the bank economists as if they are useful indicators. When official numbers are obviously wrong as has been the case at times with reported employment growth it undermines my faith in the quality of the official data more generally. Without quality data there is much larger scope for bad decisions to be made in a range of areas including monetary policy.
There is a huge difference between 3.7% and 2.8%
GDP growth When SNZ reported the June quarter GDP numbers in September last year it reported that GDP increased 0.87% in the March quarter and 0.94% in the September quarter equating to an annualised growth rate of 3.7% over the two quarters. When the September quarter GDP numbers were released in December the increases for the previous two quarters were revised down to 0.68% which equates to an annualised growth of 2.8% over the two quarters. There is a huge difference if the economy is growing at an annual equivalent rate of 2.8% versus 3.7%. In the former case there isn't concern about the economy being overheated meaning the need for interest rate increases but a 3.7% growth rate is well above the rate consistent with keeping inflation low on average over the medium-term meaning interest rate increases are warranted. Maybe the revised estimates are more accurate but I am left wondering about the overall quality of the surveys behind the official GDP numbers and about whether the new numbers are more accurate than the old ones. Maybe neither are particularly accurate due to dubious-quality surveys.
To some this may seem a trivial matter but to me the extent of the revisions to the GDP and unemployment rate numbers and the misreporting of actual employment growth leave me questioning what is going on at SNZ. Quality government policy, monetary policy, business and investment decisions rely on quality inputs and I would have thought that in a developed economy like NZ we could rely more on the quality of the official data than seems to be the case. This comment needs to be viewed in the context of official numbers in other countries also experiencing significant revisions from time to time. My concern is more about what appears to be an increase in the frequency of major revisions in NZ. An independent review of data practices at SNZ may be warranted although again I suspect a major issue could be a lack of funding.
*Rodney Dickens is the managing director and chief research officer of Strategic Risk Analysis Limited.
5 Comments
Totally agree with the skepticism of this article.
Data is presented often as if it is untouchable, and truly objective and free of imperfections.
My professional experience with it, like Rodney's, suggests otherwise.
Banana Republic stuff folks!!!!
81% of statistics are made up...
Rodney, totally agree. Stats NZ requires more funding. i often are reliant on their data in real time. The early leaking, I can cope with., Its the multiple revisions that leave me wondering whether darts are given out. The GDP numbers which I have tested back to 2008 are sometimes astonishing in the scale of revisions , which have been generally downward. The unknown recession of 2010, the December 2013 original growth of 0.9 percent, down currently to 0.0. Obviously the quarter in question is at the mercy of the revisions around it,but something is wrong when a percentage point is stripped off growth in a single quarter. The rock star economy , simply was not rocking in the way portrayed , and was more often looking for a rocking chair ,
Why the picture of John Cleese? Is it just that he has a sceptical expression on his face? I don't want to miss a Monty Python reference.
The following response has been received from Statistics NZ:
Statistics New Zealand agrees with Interest.co columnist Rodney Dickens that it is important official figures are robust- they must also be impartial and represent our best understanding at the time.
Dickens’ column (Opinion February 28- http://www.interest.co.nz/opinion/86238/rodney-dickens-thinks-underfunding-statistics-nz-bringing-higher-level-uncertainty) discussed the accuracy of official numbers, and how revisions and errors can affect the confidence of our user community.
Stats NZ welcomes feedback of this nature, and the opportunity it provides for us to improve.
We agree that official statistics are vital for decision-makers from the Reserve Bank and government policy-makers, to investors of all kinds, whether they are putting money in the bank or setting up a corner dairy.
As Dickens points out there have been errors with some figures recently. Stats NZ is transparent about errors, often found by ourselves - we own up to these errors and make changes as quickly as possible.
In the case of revisions, these are usually driven by new or improved data that affect historical results, or changes to the underlying measure – in both cases we aim to better represent the real life situation of a changing society, economy and environment.
Where possible, we try to give our users as much notice as possible about the planned revisions. We explain the changes and even in some cases publish a revised back-series before new revised data comes out.
In both the case of error corrections and revisions, our goal is to get the most accurate data out to everyone.
Stats NZ welcomes close scrutiny of official figures - it is in everyone’s interest to make sure they are accurate. We welcome questions from economists, media or anyone else to help them understand the data.
Rachael Milicich
General Manager Products, Services & Insights | Ngā Hanga, Ratonga, Kitenga
Customer Strategy & Delivery | Rautaki Kiritaki me te Whakaratonga
Statistics New Zealand | Tatauranga Aotearoa (www.stats.govt.nz)
We welcome your comments below. If you are not already registered, please register to comment
Remember we welcome robust, respectful and insightful debate. We don't welcome abusive or defamatory comments and will de-register those repeatedly making such comments. Our current comment policy is here.