

By Benje Patterson*
Private sector debt in New Zealand stood at $456bn in March 2019, the equivalent of almost $92,000 for each of our 4,957,400 men, women and children.
New Zealand’s debt can be broadly split in three types:
- household debt
- business debt
- agricultural debt
These three debt types accounted for approximately 98% of all private debt in New Zealand. We will explore each of these debt types in turn.
Household debt accounts for 60% of private sector debt
Household debt is the largest contributor to private sector debt, accounting for 60% ($271bn) of the total.
The following table breaks this household debt into its parts.
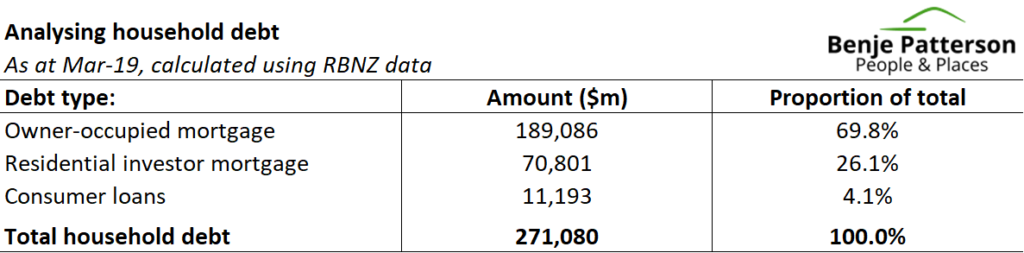
Most of the household debt is in the form of residential mortgages, spread across mortgages to owner-occupiers (70%) and residential investors (26%). Only a small proportion of debt (4.1%) is in the form of consumer loans (like personal loans and credit cards).
The average mortgage is $160,583
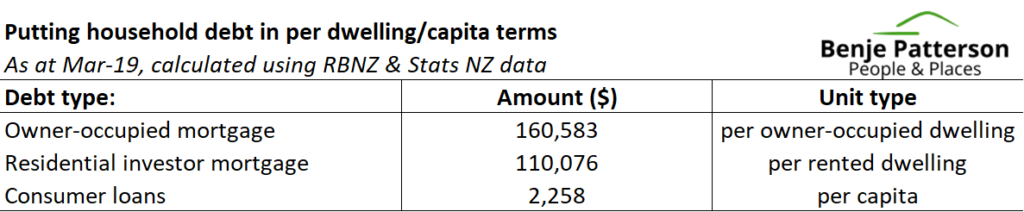
Much can also be learned from considering household debt in per dwelling or per capita terms.
The following table shows that the total value of outstanding mortgages to owner-occupiers is equivalent to a $160,583 mortgage for each owner-occupied dwelling in New Zealand. By comparison, the total value of outstanding mortgages to residential investors is equivalent to just $110,076 per rented dwelling. This finding flies against the commonly-held view that most rented residential properties are controlled by highly leveraged investors.
At first brush, mortgage debt appears relatively low compared to average house prices of approximately $687,000 (as at March 2019). However, one needs to bear in mind that the distribution of debt is what matters for considering how risky it is for financial stability. In its May 2017 Financial Stability Report, the Reserve Bank of New Zealand (RBNZ) found that 19% of households, who had taken out a new mortgage, had debt levels that exceeded 5 times their income. Only 6% of existing borrowers, on the other hand, had that same level of indebtedness.
Turning to consumer debt, the table shows that consumer debt is just $2,258 per capita. In per household terms, this consumer debt represents the equivalent of $6,345 per household. Compared to mortgage debt, these consumer loan amounts may appear low. However, remember that consumer debt is often higher interest bearing and not usually secured directly against assets that hold their value, such as a property.
Business debt accounts for 24% of private sector debt
Business debt is the second largest contributor to private sector debt, accounting for 24% ($111bn) of the total.
The following table breaks this business debt into its parts.
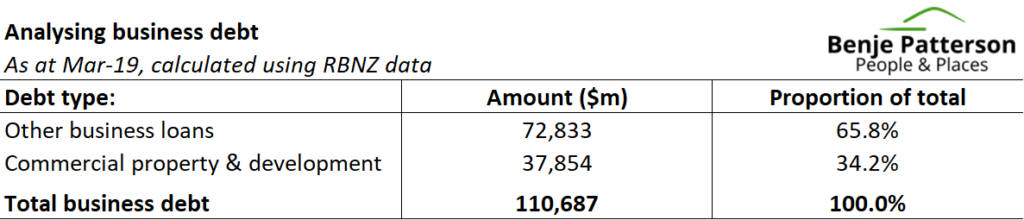
Most business debt is on assorted business loans (66%) for things like plant and machinery, or as a source of credit for working capital. Commercial property loans account for 34% of business debt and are used to finance both investment in commercial property and its development.
Business profits are ample to service debt
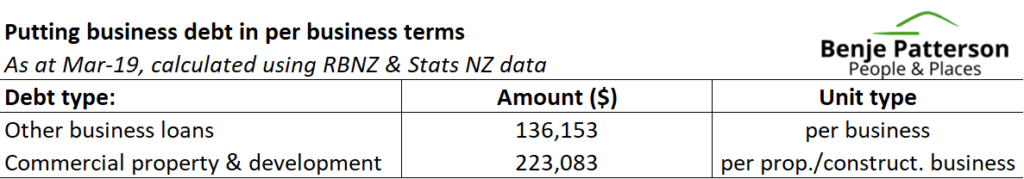
Much can also be learned from considering business debt on a per business basis.
Business Demography data from February 2018 shows that there were 534,933 businesses in operation in New Zealand, with 169,686 of these businesses operating in the construction, development or real estate space.
Using these statistics on business units highlights that each business in New Zealand carried an average of $136,153 of assorted business loans, while there were $223,083 of commercial property and development loans outstanding for every business operating in that space.
Relative to revenue and profits, the $111bn of outstanding business loans appear to be at a manageable level. Statistics NZ’s Annual Enterprise Survey shows that total business revenue in 2018 was $691.9bn ($1.3m per business), while total business profits were $85.6bn ($160,020 per business).
Agricultural debt accounts for 14% of private sector debt
Agricultural debt is the third largest contributor to private sector debt, accounting for 14% ($62bn) of the total.
The following table breaks this agricultural debt into its parts.
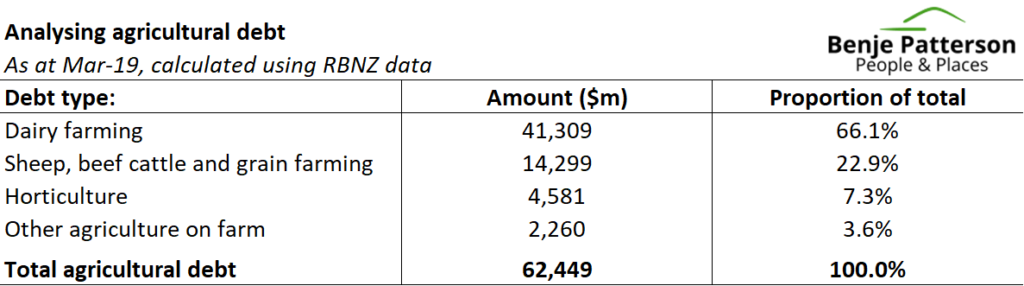
Approximately two thirds of all agricultural debt is carried by the dairy sector, while sheep and beef farmers accounted for 23% of debt. The next biggest contributor is horticulture (7.3% of debt).
Dairy debt high compared to farm values
It is once again useful to put this debt on a per business basis.
The following table displays agricultural debt on a per business basis using business unit data for each type of agriculture taken from Statistics NZ’s Business Demography framework.
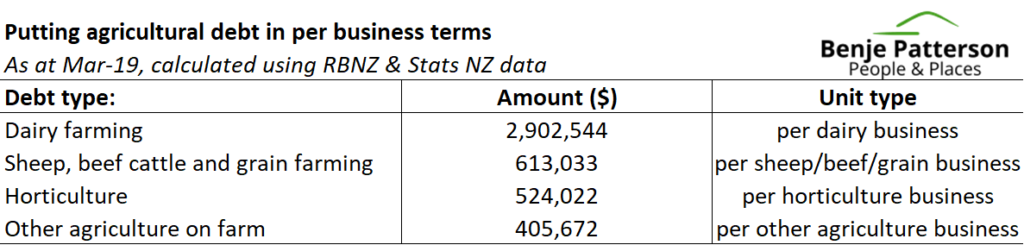
The data shows that the average dairy farm carries just shy of $3m of debt. Given that Dairy NZ reported the average dairy farm to be about 144 hectares, this debt can also be expressed as approximately $20,000 per hectare. This debt level sits quite high compared with an average sale price of dairy farms of about $25,000 per hectare in June. Previous Dairy NZ surveys have suggested that approximately two thirds of a typical dairy farm’s assets were tied up in land/buildings.
Other parts of the agricultural sector carry a much lower level of debt per business unit.
Dairy debt also high compared to exports
Another way to express business debt is by comparing the debt to export earnings to get an indication of how much debt it takes to generate $1 of exports.
The following table shows debt of the dairy, sheep/beef and horticulture sectors against export receipts for each sector. Other agriculture is not covered due to data limitations.
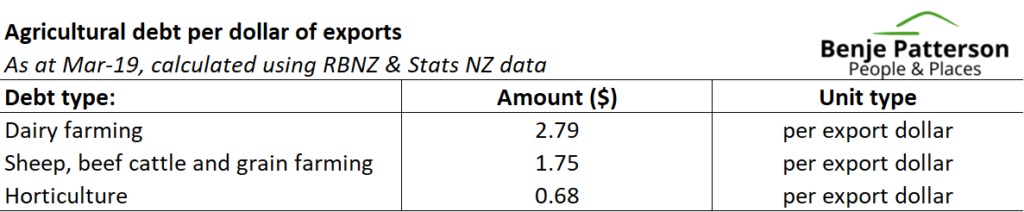
The data again clearly shows that the dairy sector has a much higher level of indebtedness than its peers in sheep and beef, and in horticulture. There was $2.79 of dairy debt carried for every $1 earned in dairy exports during the March 2019 year. By comparison, the horticulture sector carried just 68 cents of debt for every $1 of export earnings.
Concluding remarks
This article gave some basic metrics for understanding which parts of New Zealand are most indebted, and what that debt means for each household and business.
Following the indebtedness of key parts of the economy is important for understanding the balance of financial risks we face.
Debt itself is not inherently bad – we need to borrow from time-to-time to smooth cash flows and invest in assets. We do need to be careful though that the debt we take on is used in productive ways over the long-run.
Debt is something we should talk more about as a country. The challenge though is that much of the data on debt provided by organisations such as the Reserve Bank is not in a format accessible to many.
*Benje Patterson is an economist. This article first appeared here and is used with permission.
41 Comments
"Dairy NZ reported the average dairy farm to be about 144 hectares, this debt can also be expressed as approximately $20,000 per hectare."
Let's do some simple math here, to yield a context missing from the piece:
Assumptions:
- 2 coos/ha
- 450 Kg MS/coo
- $7.50 revenue/KgMS
Calculations:
- Revenue/ha = 900*7.5 = $6,750
- Revenue/debt per ha = $6750/$20000 = 33.75%
- Interest cost of debt at a WACC of 7% = $1,400/ha
- Debt servicing to revenue ratio = 1400/6750 = 20.74%
Isn't majority of this debt disproportionately owed by a small number of dairy farmers? Hopefully low interest rates, low NZD and upbeat dairy prices will help these indebted farmers deleverage quickly.
Think you'll find the dairy farmer is but a small part of the equation.
The main cause is the corrupt banking system, which has lead to the high cost of living in NZ, compared to wages. Other causes of these high costs include:
1. Cartel price practices employed by businesses that control life's essentials.
2. For the most part, businesses that control life's essentials are predominately owned by overseas owners.
3. The export of super profits, facilitated by price control and internal transfer cost charges.
4. Multi national companies that don't pay their fair share of taxes, and use Tax havens to park their abuse of power.
5. The lack of political will to regulate these parasites.
6. Professional politicians more interested in furthering their political careers, by kicking the can down the road.
7. Democracy in its current form, which is heading towards communism.
8. Baby Boomers apathy to the current system, which has pampered them.
The same problems aren't limited to this country; with most western democracy experiencing these. Solutions are coming, if you haven't noticed. The youth which the boomers have produced now feel entitled, and are matching on the streets; demanding a more balanced approach to so called modern democracy.
You lost me at communism... We are far from that. We are a neoliberal democracy - whether we have national or labour in power.
Revenue is not EBIT
"Benje Patterson believes current policy settings protect the interests of people who are least in need and will unnecessarily exacerbate intergenerational tensions."
I'm not sure that comes across in the above.
In reality he might be right.
The RBNZ claims around two thirds of NZ households have no mortgages. The debt to income ratio changes dramatically when those without mortgages are excluded. Moreover, given the iniquity of the risk weighted asset regulatory capital scheme, around sixty percent of bank lending is allocated to residential real estate for one third of households.
This reality is at best unsettling for the debt dependency NZ has developed buying and selling mostly non GDP qualifying residential property assets to each other, and hardly fits in with Mr Orr's new found claim: "There has never been a greater time to make use of accommodative monetary policy for investing in productive assets."
Similar issues in NZ as in Australia
Audaxes,
In the UK, accommodative monetary policy in the form of QE led directly to a significant rise in financial asset prices. The BOE's own estimate was that it led to a 20% rise in share and bond prices. In the US, much of the new money never left the banks, as they could earn interest from the Fed. just by leaving it there. I absolutely agree with you on the issue of risk-weighted capital.
We are owned by the Banks! All hail the Banks! Don't piss them off they'll cut your debt off at the waist!
Jacinda has come out today and wants us all to invest away, no issues here....
More debt is the way forward in other words.
Local Authority debt is effectively household mortgage debt too. So lets add the $20 billion 2025 projections and then divide by the labour force number of 2.6 mill (forgetting the unemployed). Now we have $183,090 per head. That would be enough just for a home owner - but more and more are renters. Looking not so flash.
The incredibly scary thing about this debt is that the Councils are not planning on paying it down! Ever!
As sad as its sounds, being fiscally constrained by debt is a good thing for Councils.
The yes culture would otherwise encourage them to spend more of dream schemes they are incapable of delivering, and/or shouldn't be doing in the first place..
But the Fuller story here is that the value of the assets/improvements that the council's borrowed money has brought is capitalised into house prices ( there a study somewhere confirming this). So the loans are taken out by the current generations on the pretext that the asset will be used into the future so future generations must pay, but with house prices pushed up by this they sell to the next generation who have to borrow more for the house AND pay off the council debt.
Guess which generation does best out of this.
Not sure where student debt slots in here
myself and many of my farming friends have no debt.
The central banks are firmly on the side of the indebted, I don't see a happy ending.
So it's you and your friends fault. Ba#__$_ds.
yes it was me, however it's isn't always best to be conservative with investments.
Old money
Interesting article. I kept humming the man from snowy river while I was reading it.
Can Mr Patterson tell me if the consumer debt includes outstanding credit card balances? If so, what percentage of credit card debt actually pays interest. Personally my credit card is linked to my bank account and is paid off in full each month.
It would be interesting to see this analysis done excluding households that have no debt to get a true average for houses that have mortgages.
Then split it by 5 year age brackets to show how indebted the younger brackets are (25-29 / 30-34 / 35-39)
The following table shows that the total value of outstanding mortgages to owner-occupiers is equivalent to a $160,583 mortgage for each owner-occupied dwelling. If that is every owner occupied home in New Zealand and not just those with a mortgage. You are statistically taking the piss.
Or written another way. In the May 2017 Financial Stability Report, the Reserve Bank of New Zealand (RBNZ) found that 25% of households, who had taken out a mortgage, had debt levels that exceeded 5 times their income.
From the same report November 2018. If you seperate out Auckland only mortgages the percentage that have Debt to Income greater than 5x is close to 60%
As per certain avid support camp on this web site; I would recommend, that we change our kids education/financial literacy/money awareness educations folks.
..take out more loan, world only turning because of debt, saver is for looser. Get your first loan from your parents, that is the only KEY way to spread this gospel scriptures, IF we want our next generations off from squabbling like kids, about the important of savings vs risky loan borrower.. if all of them converted? to be a property/RE loan borrower?... then we all in fully agreement in the future about it.. no more camp left or right. It's one sided camp will be - Anyone, specially on the property bull/RE willing to dispute this suggestion?
$92,000 per person
Meanwhile, at RBNZ: "People need to get out there and take on more debt!"
Prime Minister Jacinda Ardern says the economy is in "good heart" and warns businesses about talking themselves "into a funk"
"Ardern said the low business confidence had stemmed from uncertainty".... seriously Jacinda, there are some serious reasons for low business confidence. Lack of faith in the Gov'ts inability to deliver and or impliment is one of the top two.
"The message is clear – now is the time to invest. New Zealand is doing well and there are enormous opportunities if we act now"
Seriously Jacinda???? You want to call a spade a spade and confront issues but then treat us as stupid. More debt for the masses, let's have $150,000 debt per man, woman and child in NZ....
https://i.stuff.co.nz/business/117590206/prime-minister-jacinda-ardern-…
I agree Labour is not inspiring confidence at the moment however as for the Debt, regardless of who is in power, we will have and need more debt. Otherwise we will be in a recession. This is our system. Inflation targeting is achieved by taking on more debt so more money is introduced to the economy. It’s an incredibly and foreseeably dumb system but it’s what we’ve got and no one wants to do anything about changing it.
No matter what, we are going into recession. B.S#^ting us is very see through.
Jacinda who stands for the rights of everyone just B. S#^Tted the entire country.
I grew up when debt was bad and you worked hard to pay off as quick as you could, 2nd third jobs don't spend
now we are told debt is good and use leverage to make it even better, invest in bricks and mortar
what could go wrong
Great for Banks and their masters. And bad for kiws, who are increasingly debt slaves to offshore banking interests
Not just banks, supermarkets, building supply industry, electricity, lots in on the racket.
My friend has low income housing in Hastings in two years he has increased rents from $260 to $440, mostly Islanders, all on accomodation supplement , he says it's a win win scenario. So they pay 10k a year more than they should for housing 10k a family more for food, then electricity, rates etc and there is no disposable income left.
Dairy farmers have been suffering %7 compounding inflation for 10 years, which means their costs have doubled, so $6.50 is worse than the old $4.40, drowning them.
he has increased rents from $260 to $440...all on accomodation supplement
Money wasted in middle class welfare flowing to landlords of 300,000 rentals in NZ. What a rort.
Why did we choose to hang or hats on Debt? Ever since the early 70’s there has been an explosion of asset prices due to debt/credit/money creation by the banks and now we can never go back unless we have a giant deleveraging event. I guess we are currently stuck worshipping at the alter of the foreign banks.
In view of the above, are the Banks' annual imapired debts reserve adequate, do you think ?
Isn't RBNZ on the right track by asking them to hold more capital/reserves ?
The prevailing view that inflating asset prices (farms, houses, shares etc.) is the silver bullet needs to be taken to its conclusion before reserve banks and governments will embrace alternative views. We will actually have to get to a level where our productivity growth will be highly negative and there is a recession despite negative rates and/or QE before there is substantial restructuring of the economy towards genuine productivity growth.
When broken down , its nowhere as bad as the headline would imply . At $92,000 per head , that my family (wife and 3 adult offspring) have nearly half a million in debt between us
The truth is , that between us we have no net debt at all , after factoring in savings , cash on hand , Kiwisaver balances and so on .
Well, the figures Are Averages, after all. You're at the top of the Good Side of them averages. But, oh noes, that must mean that a lotta peeps at the Other End owe squillions per head. It's a Debt Emergency! How Dare You - er - Them - er - Us?
Paupers
I can buy 99acres with trees on it for $40,000 plus property taxes
How could land be worth so much at the other end of the world where the biggest dairy company
is failing to perform ?
NZ is all out of whack it’s values distorted by outside ponzi money
I know I got paid & sold out
It’s like people believe the story of ever increasing property prices in a country of only 5 mill
Meanwhile in the big world they can build 10 apartment blocks in a few months
It really is amazing to see
Since the early 1990's banks in NZ have changed two key lending constraints:
1) increased debt service to income ratios from 25% to 37.6%
2) increased the mortgage term from 20 years to 30 years.
Taking the current $95,000 median household income in Auckland what has happened to mortgage sizes?
A) Changing the debt service ratio increases mortgages by 50%
1) 25% of $95,000 is $23,750. At current floating interest rates of 5.2%, and a 20 year term, this would mean a maximum mortgage of $291,000 (a debt to income ratio of 3.1x)
2) 37.6% of $95,000 is $35,724. At current floating interest rates of 5.2%, and a 20 year term, this would mean a maximum mortgage of $437,746 (a debt to income of 4.6x) - so that is an increase of 50% from changing the debt service to income ratio
B) changing the mortgage term from 20 years to 30 years increases mortgages by 23%
1) 25% of $95,000 is $23,750. At current floating interest rates of 5.2%, and a 20 year term, this would mean a maximum mortgage of $291,000 (a debt to income ratio of 3.1x)
2) 25% of $95,000 is $23,750. At current floating interest rates of 5.2%, and a 30 year term, this would mean a maximum mortgage of $356,918 (a debt to income of 3.75x) - so an increase of 23%.
C) combining the multiplicative effects of increasing debt service to income ratios to 37.6% and extending mortgage terms to 30 years has resulted in an 86% increase in mortgage sizes
1) 25% of $95,000 is $23,750. At current floating interest rates of 5.2%, and a 20 year term, this would mean a maximum mortgage of $291,000 (a debt to income of 3.1x)
2) 37.6% of $95,000 is $35,724. At current floating interest rates of 5.2%, and a 30 year term, this would mean a maximum mortgage of $542,000 (a debt to income of 5.7x) - this is a 86% increase in mortgage sizes.
As a result, this is likely to have contributed to higher houses prices.
1) an 80% LVR on a mortgage of $291,000 (25% debt service to income, 20 year mortgage) would mean a house price of $363,778 (a house price to income of 3.8x)
2) an 80% LVR on a mortgage of $542,000 (37.6% debt service to income, 30 year mortgage) would mean a house price of $677,500 (a house price to income of 7.1x) - so an increase in house prices by 86%
3) Put another way, could house prices today be 46% lower if the lending terms by banks had remained the same as in the early 1990's as owner occupiers were constrained on mortgage amounts lent by banks?
Refer mortgage calculator and plug in $95,000 for household income which results in maximum mortgage amount of $542,000, monthly payments of $2,977 ($35,724 per annum or 37.6% of gross household income), and a 5.2% floating rate mortgage for 30 years. - https://www.asb.co.nz/home-loans-mortgages/calculator-borrowing.html
As a comparison, look at what amount the US banks would be willing to lend on the same income and similar interest rate, plug in $95,000 in household income and adjust for 5.5% interest rate (comparable to NZ interest rates), and a 30 year mortgage.
https://www.bankrate.com/calculators/mortgages/how-much-money-can-i-bor…
1) $95,000 income
2) interest rate 5.5%
3) mortgage amount of $300,679 (a debt to income of 3.2x)
4) $2,217 monthly mortgage payment (annual amount of $26,604 - a debt service to income ratio of 28%)
While in NZ:
1) $95,000 income
2) interest rate of 5.2%
3) mortgage amount of $542,000 (a debt to income of 7.1x)
4) $2,977 monthly mortgage payment (annual amount of $35,724 - a debt service to income ratio of 37.6%)
https://www.asb.co.nz/home-loans-mortgages/calculator-borrowing.html
We welcome your comments below. If you are not already registered, please register to comment
Remember we welcome robust, respectful and insightful debate. We don't welcome abusive or defamatory comments and will de-register those repeatedly making such comments. Our current comment policy is here.