

 By Rodney Dickens*
It was pleasing to see that at the same time as hiking the OCR 0.25% to 3% on 29 July, Governor Bollard stated that further increases would be less than previously expected.
However, there is still a fundamental and glaring error in the RBNZ’s assessment of economic growth prospects.
To be kind to the RBNZ, all the 10 economic forecasters surveyed by NZIER in June are making the same mistake. In contradiction to how things actually work, they are predicting significant increases in interest rates and robust growth in residential building activity.
Not surprisingly, a leading figure in the residential building industry – Richard Carver, Director of Jennian Homes – has taken the RBNZ and the economic forecasters to task over their residential building forecasts. Here is his media release.
And this is not a case of sour grapes.
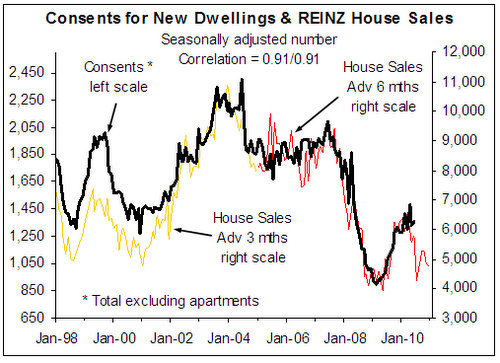
Our leading indicator analysis, which has a fantastic track record at picking the near-term outlook for residential building among other things, has identified the risk of an imminent and significant fall in the number of consents for new dwellings over the next two quarters.
The first chart below shows the number of house sales reported by REINZ each month as a useful leading indicator of the number of consents for new dwellings (excluding apartments), with the red house sales line advanced or shifted to the right by six months reflecting the lead house sales have had over consents since the consenting process was altered in 2004/05.
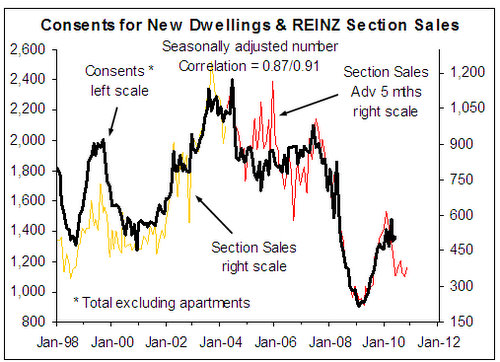
The next chart below shows the number of REINZ section sales as an equally useful leading indicator of consents, with the red section sales line advanced by five months (i.e. providing a prediction for consents over the next five months).
The tumble in house and section sales over the last couple of quarters point to the risk of significant downside in the number of consents for new dwellings over the next couple of quarters.
These charts make a mockery of the economists’ forecasts for residential building, which in turn makes a mockery of their interest rate forecasts There is more to the story than the economic forecasters having a topsy-turvy view of the relationship between interest rates and residential building activity, and them not understanding how people are responding the housing affordability nightmare.
The initial indications are that the changes in property tax introduced in the Budget will have the same impact on housing activity as a 1-1.5% increase in mortgage interest rates.
If this proves to be the case it hugely undermines the need for the RBNZ to hike the OCR over the next 6-12 months.
The key question seems to be not whether this will halt OCR hikes, but how quickly Governor Bollard will realise that the RBNZ’s forecasts for residential building activity and economic growth are still way too optimistic.
See a full version of this 'Rodney's Raving' here.
Why the economists are so wrong
So what is going on with the economists’ residential building forecasts and why can they be so, so wrong! Having many, many years ago started my career as an economists working at the RBNZ, including having been involved in building a version of the RBNZ’s forecasting model, I have seen first hand what really drives the central bank’s economic forecasts. While the bank economists in general don’t even have proper forecasting models and when it comes to predictions for the likes of interest rates and residential building have a tendency to “flock”.
When it comes to interest rate forecasts (and exchange rate forecasts) the economists almost without exception predict that they will revert back to around the historical average or mean. All they are doing is predicting that the 90-day bank bill yield will increase to around the historical average level. There is no science in this, just an assumption that things will return to “normal”. The same thing is driving the economists’ residential building predictions (i.e. on average they are predicting that the level of residential building activity returns to around an average level over the next two years).
But we live in the aftermath of a speculative bubble in house and section prices that still hasn’t burst, associated with the housing bubble is stacks of debt, and we are still living in an environment in which the international financial crisis is having and will continue to have a major impact.
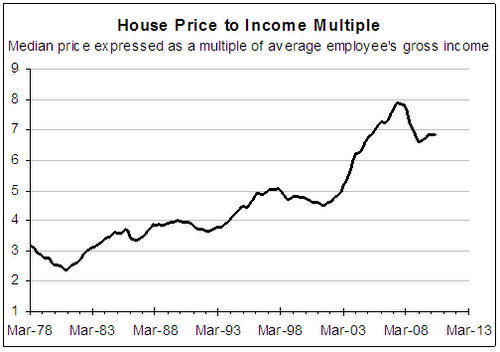
In short, to assume that the level of housing activity and interest rates will return to “normal” or average levels is either naïve or dumb, but probably both. As covered in the Housing Prospects reports, house prices remain extremely high compared to incomes (chart below).
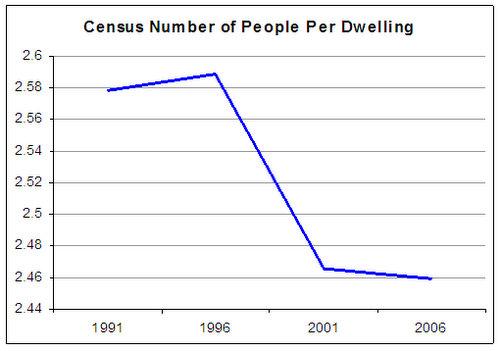
This is giving people the incentive to economise on housing (e.g. young people/couples stay at home longer or move back home; people take in boarders to help pay the rent/mortgage; people convert garages to living quarters; retired people hit by finance company failures move in together).
In the 2006 Census there were 2.46 people per house on average. If the number of people per house increases to just 2.5 it means that roughly 26,400 less houses are needed.
Housing shortage a myth
This is what is currently going on in NZ and is why, as Richard Carver says, “The predicted housing shortage, at this stage, appears to be just a myth”.
It is just a myth even if some of the economic forecasters don’t realize it yet.
People responding to a major incentive, like extremely expensive housing, is the sort of thing that economists are taught should happen when they study at university, but for some reason they are too willing to assume this sort of behaviour away in their desire to predict that things will return to “normal”.
The housing market isn’t the be all and end all of economic growth. The story at the moment is about the economic recovery that started in the housing market and export sector filtering around the economy.
This is the “broadening” of the economic recovery driven by the “economic multipliers” of text book economics we discuss in the Interesting Times reports. However, as this chart below shows, cycles in residential building activity are critical swing factor in economic growth cycles.
If residential building activity falls significantly, economic growth will slow significantly.
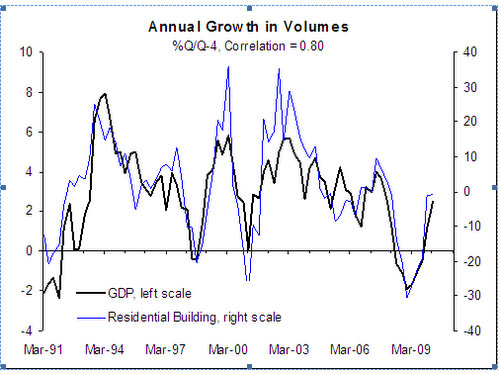
Residential building on its own doesn’t make up a large share of economic activity – only 3.6% in the year to March 2010 (normally around 5%) – but it feeds many other industries including significant parts of the manufacturing sector.
If residential building activity falls as much over the next few quarters as the fall in the number of REINZ house and section sales are predicting, negative economic multipliers will start filtering around the economy over the next coupler of quarters. This means that economic growth will be well below the 3.6% predicted by the RBNZ for the 2011 calendar year.
Property tax changes mean few OCR hikes are needed
But there is more to the story than the economic forecasters having a topsy-turvy view of the relationship between interest rates and residential building activity, and them not understanding how people are responding the housing affordability nightmare.
The changes in property tax introduced in the Budget have had the same impact as a 1-1.5% increase in mortgage interest rates, which hugely undermines the need for the RBNZ to hike the OCR over the next 6-12 months.
Why has the number of house sales reports by REINZ tumbled back towards the trough levels experienced during the 2008 recession?
There is an inverse relationship between the number of house sales and the average mortgage interest rate.
More than just interest rates drive house sales, but interest rates are the most important cyclical driver.
If all other factors are stable, a 1% (one percentage point) increase in the average mortgage interest rate will result, with around a three month lag, in a 1,150 drop in the number of houses sold each month.
In that context, part of the sharp fall in the number of house sales this year can possibly be attributed to the earlier increase in the average mortgage interest rate.
However, with floating and short-term fixed mortgage interest rates remaining low, the increase in the average mortgage interest rate driven by rising medium-term and longer-term fixed mortgage rates, shouldn’t have had as large an impact as normal.
And even if we assume the increase in the average mortgage interest rate had the normal impact, it still only explains around half of the fall in the number of house sales.
Falling net migration is part of the story, but the main candidate for the fall in house (and section) sales is the property tax issue. It came to prominence early in the year and we have no doubt drove the tumble in the number of sales in January, when investors took fright at the prospect of tougher tax treatment of property investments.
In our assessment the property tax changes have had the equivalent negative impact of a 1-1.5% increase in the average mortgage interest rate.
RBNZ 'way off the mark'
If the fall in house and section sales is roughly mirrored in the number of consents for new dwellings over the next couple of quarters then the RBNZ and economic forecasters will have to make major revisions to their residential building, economic growth and interest rate predictions (i.e. life will go on a normal).
The key question at the moment is not whether this will halt OCR hikes, but how quickly the RBNZ will realise that its forecasts are way off the mark even after suggesting they have downgraded them on 29 July.
We discuss this in detail in the Interesting Times reports and the Monetary Policy Briefing reports, which provide the best available insights on things like economic growth and interest rate prospects, why we don’t expect short-term wholesale interest rates to increase anywhere near as much as the economic forecasters are predicting.
Contact Rodney if you want to know more about any of our reports, while if anyone wants to know what really drives economic growth there are some spaces still available at the Economic Workshop he is running on 3 August (see here for info).
* Rodney is the MD of Strategic Risk Analysis, which prepares and sells reports on housing, construction, monetary policy and exchange rates. He produces a regular 'Rodney's Raving' which is available on his site here.
1 Comments
I heartily recommend people read this piece. It's long and detailed, but challenges the RBNZ view on where new home building is going, the need for new house building and the impact of recent property tax changes.
He is saying the RBNZ has underestimated the impact of the tax changes and doesn't need to hike the OCR as much because of it. He is saying the tax changes are 'worth' up to 1.5% of OCR increases.
If true, and the RBNZ has to change its forecasts because of this, this would reduce the likely peak for the OCR and suggest the housing market and the economy is in for a very rough time.
Many thanks Rodney.
cheers
Bernard
We welcome your comments below. If you are not already registered, please register to comment
Remember we welcome robust, respectful and insightful debate. We don't welcome abusive or defamatory comments and will de-register those repeatedly making such comments. Our current comment policy is here.