
The commitment of households to housing picked up in the September quarter of 2019.
According to the M10 data release by the RBNZ (based on CoreLogic sources), households saw the value of housing rise by +4.7% in the year. This is the fastest rate of increase in 2019, rising from a +3.7% rate in the June quarter.
This data allows us to derive the value of household rental housing investments, because we have the value of owner-occupied housing in the C22 series.
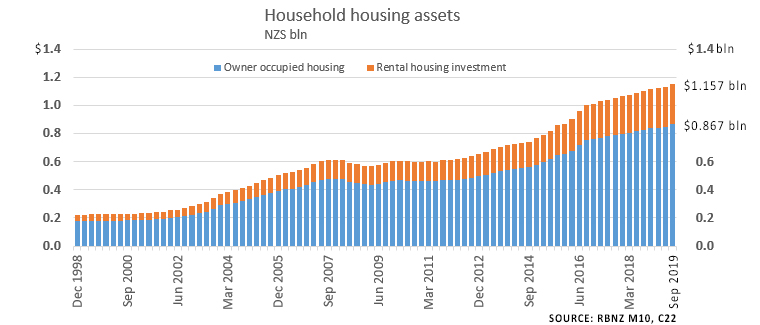
As at September, the value of the housing owners lived in was $857.0 bln. The value of household investment in rental housing was another $290.4 bln. Together, New Zealand households now have an asset in residential housing of $1.157 tln, a new record.
In the past year, the value of all housing stock has risen by $52 bln. But what is remarkable is that half of that rise came in the thirteen week to September 30, 2019.
While these rises may seem large, they are not record gains, and not by a long way. The largest annual gain occurred in the year to December 2016 when it rose by +$140.7 bln. The largest quarterly gain occurred in the 13 weeks to June 2016 when it rose by an eye-popping +$54.5 bln (or +$4.2 bln per week).
Separate Statistics NZ data released today shows there were 609,700 tenanted residences at the end of September. On that basis, the average value of rented dwellings is now $486,300. That is up +5.3% from the average value of $461,650 in September the year prior. Capital gains on renters are reappearing, although other data suggests that these gains are in regional urban centres, rather than in Auckland, Christchurch or Queenstown. On average, the gains amount to $475 per week. They are gains that are untaxed, unlike similar capital gains from holding many equities.
C5 RBNZ data shows that all mortgages for all housing at September 2019 involved a debt liability of $271.5 bln. By implication, New Zealand households have equity in their housing stock holdings of $825.9 bln. This grew +$21.7 bln in the September quarter, the fastest rise since 2016. The average quarterly rise over the previous three years was just +$8 bln. Many owners may dust off their ATM playbooks.
We welcome your comments below. If you are not already registered, please register to comment
Remember we welcome robust, respectful and insightful debate. We don't welcome abusive or defamatory comments and will de-register those repeatedly making such comments. Our current comment policy is here.