

We are back in the money again. But the bad news is that we've still got a heck of a lot less free cash than we had a few years back. And we are starting to borrow more. Again.
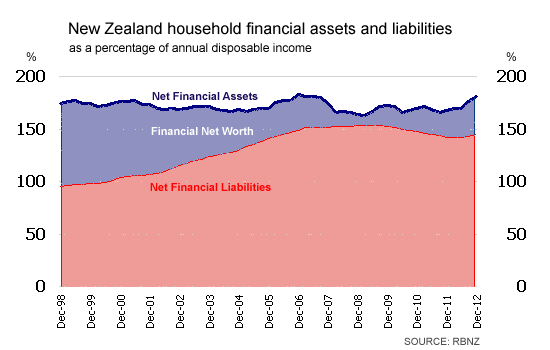
Latest household financial assets and liabilities figures released by the Reserve Bank show that kiwi households as of December - excluding house values - were worth NZ$239.5 billion, that's an impressive rise of 9.58% in the year. In fact, it was the highest percentage gain in financial assets for the country since the 14.2% gain recorded during the height of the last housing boom in 2006.
More encouragingly, the figure for net financial wealth - if you subtract that pesky debt from the overall asset figure - was NZ$48 billion, up from NZ$33.7 billion the year before, and nearly four times the figure of only NZ$12.9 billion of net financial assets held by Kiwis after the twin effects of the housing boom hangover and global financial crisis in 2008.
So, while the NZ$48 billion of net financial wealth represents a fine recovery from the depths of recession not to mention considerable depression about our financial woes, we shouldn't get ahead of ourselves. If you go back to the late 1990s Kiwi households had net financial wealth in excess of NZ$50 billion. And remember these figures are not inflation-adjusted. So, recovery or not, we are still a long way behind where we were in terms of the net financial position of Kiwi Household Inc.
The asset figures as just described don't actually include the value of houses owned by Kiwis, and which are of course a significant part of the overall value of the average Kiwi. They do include borrowings for houses, however.
The house values are included separately, but the December data are not available yet. However, as at December 2011, the total house value attributed to Kiwis was NZ$614 billion. Given the way prices have risen in the past year, a figure certainly north of NZ$650 billion could be expected for December 2012. If you include house values, Kiwi households had a net financial worth of NZ$636 billion in 2011, which was slightly higher than the pre-GFC peak of NZ630.7 billion in 2007. Presumably the figures from December 2012, when available will show a strong rise in net household wealth, including house values.
But excluding house values, the rise in the asset values of Kiwi households in the past year is in the main a reflection of increases in the amount Kiwis have in the bank and the growing impact of KiwiSaver plus other funds under management. Money on deposit, mainly with banks, hit a new high of NZ$118.6 billion, while superannuation - which now includes over NZ$15 billion in KiwiSaver - hit a new peak of NZ$36.7 billion. Other funds under management reached a new high of NZ$31.2 billion.
Interestingly, while growing numbers of Kiwis now have indirect investment in shares because of their KiwiSaver plans, the value of shares directly held by New Zealanders in the NZ market jumped by about a third in the past year to a new high of over NZ$20 billion. There are two points to note about that figure, however. It's only just ahead of the NZ$18 billion Kiwis had in domestic shares in 1986 and the figures aren't inflation-adjusted. The other point is that the NZ market overall rose by about 24% in the past year, so that would have largely accounted for the increase, rather than any major new surge in share investment.
Well, that's the assets. But of course that's only half the picture.
Households have been keeping the liabilities, or to use the more basic term - borrowing - under check in the past few years. After an incredible period where total household debt rose an eye-watering 15% a year from 2003-2005, we've been making commendable efforts to hold that lending in check.
However, this year's total financial liability figure of NZ$191.5 billion, represented a 3.5% rise on last year's figure and was the biggest percentage gain since 2008, when everything was just about to unravel with the global financial crisis.
The rise in debt of course has come in tandem with a rise in house prices. So, we are being tempted to borrow more again. Good idea? We'll find out won't we. The RBNZ figures show that the total amount loaned by banks and non-bank lenders (it makes up virtually all of the NZ$191.5 billion figure) increased by about NZ$6.6 billion in the past year.
So, maybe that's something to be bothered about.
But more encouraging is the total household disposable income figure, which edged up to NZ$132.5 billion, from nearly NZ$130 billion. More significantly, the proportion of net household wealth to disposable income moved up strongly to 36% from 26% and is now well above the low of just 11% in 2008. Again, we should get ahead of ourselves, though, because back in 1986 the equivalent figure was 150% and it was above 70% at the start of this century.
We welcome your comments below. If you are not already registered, please register to comment
Remember we welcome robust, respectful and insightful debate. We don't welcome abusive or defamatory comments and will de-register those repeatedly making such comments. Our current comment policy is here.