

Nearly nine in every 100 loans written through New Zealand’s peer-to-peer (P2P) lending platforms are in arrears, according to the Financial Markets Authority (FMA).
Borrowers responsible for 1,469 loans, worth more than $20 million, are overdue on their loan repayments.
This is one of the insights the regulator has revealed as it has aggregated and published the data it required P2P lenders to submit in their annual returns for the year to June 30.
Peer-to-peer lending matches people who want loans with people who are willing to fund those loans. The intermediary is the peer-to-peer lending service.
The FMA's data indicates large - and most likely institutional - investors are doing a decent chunk of the lending.
While the bulk of lenders are investing smaller amounts of money (IE under $5,000), 48 have lent an average of $1.54 million each. Totalling $73.84 million, this is equivalent to a quarter of the $289.10 million of loans outstanding (loans that were still within their specified term at the end of the reporting period).
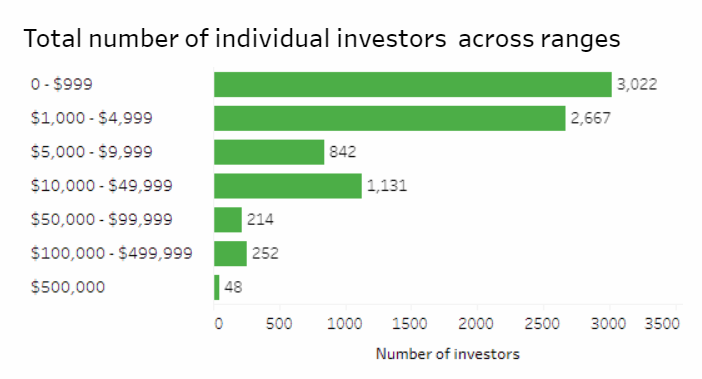
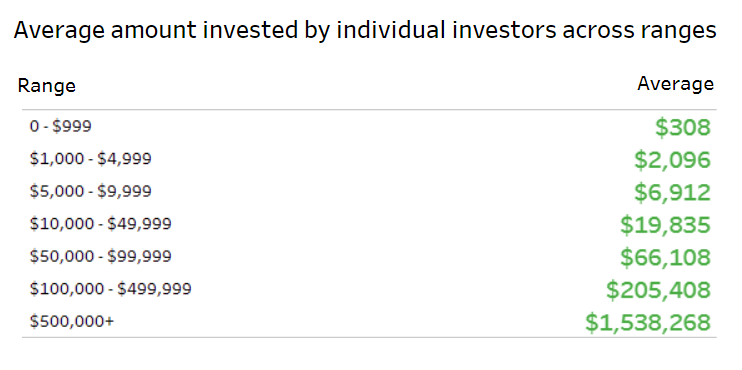
The FMA hasn’t provided a breakdown of retail versus institutional investors. However given the fact TSB has invested $50 million through Harmoney, it is safe to say a big hitter like this plays a disproportionately large role in New Zealand’s “peer-to-peer” lending market.
Harmoney - the first P2P lender to launch in New Zealand in 2014 - is also the largest, with 83% of outstanding loans in the market written through its platform.
There are seven other P2P lending platforms, one of which got a licence after June 30 so hasn’t been included in the FMA’s data.
With Harmoney only offering unsecured loans, it is not surprising that 96% of the loans in the market by number, and 78% by value, are unsecured.
Nor is it surprising that loans for businesses only making up 10% of outstanding loans by value, with Harmoney not offering loans to businesses. Individual borrowers can however use their loans for business purposes.
The FMA’s data also shows there are 207,230 borrowers registered with P2P platforms, 843 of which are repeat borrowers, who have repaid their loans and taken out new ones.
It shows the majority of loans by value have interest rates of between 8% and 24.99%.
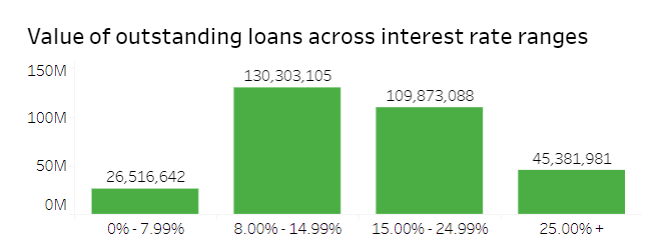
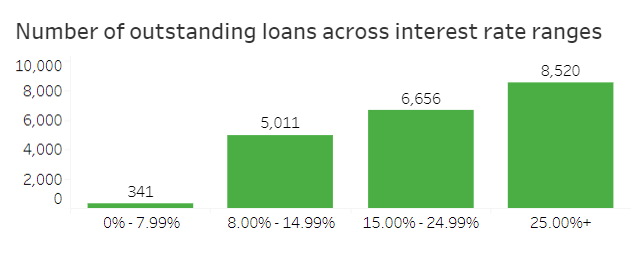
The FMA's data also shows 5,208 loans, worth $81.37 million, have been refinanced.
Meanwhile 833 loans, worth $8.53 million, have been written off.
P2P lenders compared
Below are a couple of tables interest.co.nz put together for a story in July, and updated in November, detailing the differences between the main P2P lenders in the market from an investor's perspective.
|
|
|||||
|
Who |
Part owned by founder and CEO, Neil Roberts (40%), Trade Me (14%), Heartland Bank (13%) and others. |
Part of the Squirrel brand founded in 2007 that provides mortgage broking services. Headed by John Bolton. |
Formerly LendMe. Founded by Mark Kirkland, Marcus Morrison and Edwin Morrison of Auckland-based law firm K3 Legal. Headed by Marcus Morrison. |
Part of Finance Direct Group founded in 1999. Headed by managing director, Wayne Croad and technology specialist, Bob Durrant. |
Part of the Southern Cross Financial Group, which was founded in 1997 and specialises in short term property finance and first mortgage investments. Headed by Luke Jackson. |
|
Trading in P2P since |
Sep 2014 |
Nov 2015 |
Dec 2015 |
Dec 2015 |
Dec 2016 |
|
Types of investors |
Personal & institutional |
Personal |
Personal & institutional |
Personal & institutional |
Personal & institutional |
|
Types of borrowers |
Personal |
Personal |
Personal & business |
Personal & business |
Personal & commercial property |
|
Types of loans |
Unsecured |
Secured or unsecured |
Secured |
Secured |
Property secured |
|
Minimum investment |
$25 |
$500 |
$1,000 |
$500 |
$10,000 |
|
Fractionalisation |
$25 lots |
No |
$1,000 lots |
$50 lots |
$10,000+ lots |
|
How investors are matched with borrowers |
Investors select loans individually or via their autolend criteria. |
Investors automatically matched with loans based on risk/return and terms. |
Zagga matches investors’ stated investment risk with borrowers’ credit profiles and loan requirements. |
Investors select loans. |
Investors select loans. |
|
|
|||||
|
Borrowers’ personal details disclosed to investors |
No |
No |
Yes - to registered investors and subject to terms and conditions. |
No |
No |
|
Terms |
3 years, 5 years |
2, 3 & 5 years |
Up to 5 years |
3 years, 5 years |
Up to 5 years, but generally 6-24 months. |
|
Platform makes repayments to investor on behalf of borrower if they can’t meet obligations |
No |
Yes. Squirrel pays principal and interest to investor from its Reserve Fund, provided there is money in the fund. There is currently $247,456 in the fund. |
No |
No |
Southern Cross Partners may choose to pay investors, but is not obligated to do so. |
|
Secondary market available to sell loans |
No |
Yes. A fee of 1% of the loan balance transferred, up to a maximum of $50, applies. |
Not at the moment. |
No |
Yes. A $175 fee may apply. |
|
|
|||||
|
Amount lent since inception |
$630 million |
$17.5 million |
$18.5 million incl. $12.3 million in Australia. |
$24 million |
$85 million |
|
Average loan size on current book |
$19,800 |
$16,500 |
$314,000 |
$22,600 |
$618,000 |
|
Value of loans with more than 30 days’ worth of payments in arrears against current book |
3.8% |
1.5% |
0.7% |
0.5% |
4.0% |
|
Value of loans written off against loans written since inception |
3.2% |
0.8% |
Nil |
Nil |
Nil |
|
Early repayment rate since inception |
|
33% |
13% |
38% |
|
|
Portion of loan applications approved |
23% |
23% |
30% |
20% |
30% |
|
Portion of approved loans that get funded |
99% |
88% |
50% |
100% |
100% |
|
|
|||||
|
Fees |
15%, 17.5% or 20% p.a. of gross interest collected, depending on size of lender’s total outstanding principal. |
0.95 - 2.95% p.a. of gross loan repayments made, depending on loan’s risk grade. |
0.9 - 1.95% p.a. of outstanding loan balance, depending on loan’s risk grade. |
10% of gross interest collected, regardless of the size of the lender’s outstanding principal. |
None |
|
Range of returns (after fees, before tax) |
8.8% - 19.7% |
7.91% - 8.92% |
5.44% - 12.79% |
7.4% - 16.2% |
6.25% - 8.00% |
|
Average return on current book (after fees, before tax) |
11.23% |
8.42% |
6.22% |
11.93% |
5.00% |
10 Comments
Personal experience through Harmoney. 251 loans funded from May 2015 from capital base of $20,000.
7 loans charged off.
3 loans in arrears.
ROI approx 5.6% p.a. (after tax, fees and write offs)
Bog average return for the risk borne.
Perhaps. My attitude was quite conservative. Better than a term deposit.
You're obviously investing conservatively. Also that return is after tax, which means you're getting close to triple term deposit rates.
I've got $2.5k in the game. Started with $2k as a bit of an experiment. RAR before tax has me at 15% which is 10% after tax. I started experimenting with careful selection of high interest loans, after initially seeing limited correlation between grade and defaults.
Now that the high interest rates have fallen I only invest in small loans between 15 and 25%. My book is looking really clean right now. About $3 are in arrears.
If the economy goes bad, so will a lot of these loans. And my Kiwisaver is in conservative because I expect it to go bad with the likely crash of the housing bubble.
I'm in a similar position to you, Ocelot. $2000 invested as a trial run in mid-2015 with interest reinvested up until May this year. My RAR is 15.63% and roughly 9% net after platform fees and tax. Only $6.43 in arrears and one write off of $24.43. The monthly cash flow is nice (more frequent compared to dividends/interest from equities) and it's an easy platform to use.
Is this any worse than a credit card cash advance at 22.95% when interest rates are low,especially when the bank has accepted you as a card holder.
Both of them are morally wrong.
Is it morally wrong to leverage peoples basic need for shelter over them while allowing exclusive title to all land? Is it morally wrong to limit peoples rights and access to all sorts of things and opportunities while offering little in return? Where do you draw the line in the sand. I would agree with you that usurious loans are morally wrong. But we are shown that in our modern individualistic capitalistic society that you have to play the cards as they lie or be trodden on. And I find it strange that people find it morally reprehensible that loans agreed to by consenting parties are morally wrong but exploiting peoples basic human needs for rent seeking isn't?
Does the responsible lending code apply to Peer to Peer lenders?
Have any of the loans been restructured to avoid being in arrears?
9% , thats a BIG number of non-performing loans , way bigger than a commerical bank could manage , but luckily most of the debts are under $1k
Wait for the lending to go through a full economic cycle before judging performance. Once the next recession hits, the defaults will rise and there is even a chance of negative returns. There is no secondary market for these loans so cashing out when trouble starts is not an option
We welcome your comments below. If you are not already registered, please register to comment
Remember we welcome robust, respectful and insightful debate. We don't welcome abusive or defamatory comments and will de-register those repeatedly making such comments. Our current comment policy is here.