

New Zealand’s housing shortage appears to be over, especially in Auckland.
Interest.co.nz’s latest analysis of housing supply and demand suggests the number of new homes being consented has been exceeding the demand for new housing created by population growth for at least the last three years.
It also suggests that while a shortage of housing may have built up in some areas, particularly in Auckland, more than three years ago, historical shortfall between supply and demand is now likely to have been substantially diminished, if not wiped out.
The analysis is based on Statistics New Zealand’s latest population figures, which include population changes in all territorial local authority areas, based on the natural increase (the excess of births over deaths), internal migration (people moving from one district of New Zealand to another) and external migration (people moving to or from this country long-term).
We then calculated how many new homes would need to be built to house the increased population, based on the district-by-district household occupancy levels of the 2018 Census. Those numbers were then compared to the number of new dwelling consents issued in each district.
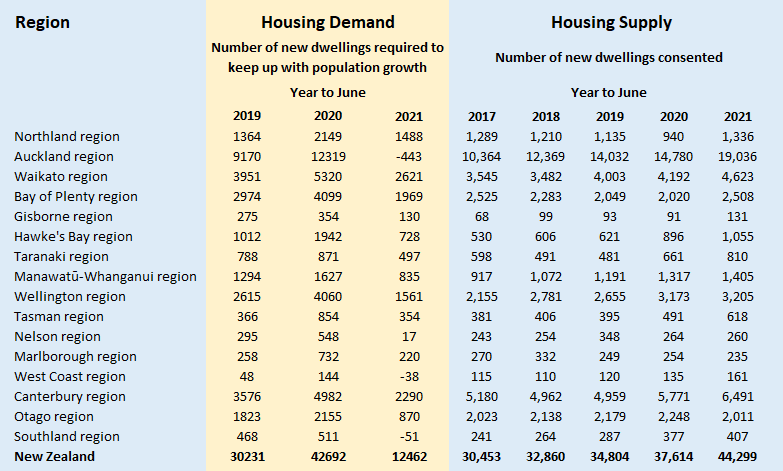
This shows that across the entire country, 30,231 new homes would have been needed to keep pace with population growth in the 12 months to June 2019, and 30,453 new homes were consented nationally over the same period. So over that 12 month period, housing supply and demand were in balance.
Then there was a big jump in population growth the following year (12 months to June 2020), mainly driven by a surge in net external migration numbers.
That pushed annual demand for new housing up to 42,692 additional dwellings, while dwelling consents increased more slowly to 37,614, leaving a shortfall of just over 5000 dwellings.
However, that shortfall was more than made up for in the following 12 months (year to June 2021) when border closures saw a dramatic decline in overseas migration, which pushed the annual demand for new homes down to 12,462.
New dwelling consents were not affected by lockdowns and border closures and continued to increase rapidly to 44,299 in the year to June 2021, giving a surplus of supply over demand of 31,837 homes for the year.
That surplus of new homes would have gone a considerable way towards diminishing, if not wiping out, any accumulated shortfall in housing supply over previous years.
Because migration remains severely restricted and the number of new homes being consented continues at near record levels, it is likely that the supply of new homes is continuing to outpace population-driven demand by a substantial margin.
However, it's worth noting that although consents are generally a reliable indicator of building activity, not everything that gets consented gets built and construction times can vary significantly.
Meanwhile there are, of course, significant regional differences.
The first chart below shows the annual demand for new homes in each region from 2019 -2021 (year to June), and compares that with new dwelling consents issued in the years to June from 2017 to 2021.
Some of the most compelling figures are those for Auckland, where migration-driven population growth has been greatest as have the consequent pressures on the housing market.
It shows that the supply of new homes in Auckland has been exceeding demand by a significant margin for several years, which would have slowly eased housing supply pressures in the region.
But what was a reasonably modest surplus in supply turned into a flood in the 12 months to June this year, when the dramatic decline in migrants coming into Auckland saw the region’s population decline for the first time since records began and the surplus of housing supply over demand skyrocketed to almost 19,500.
So it’s likely that 2021 was the year when housing supply caught up with housing demand in Auckland, and possibly overtook it. This has important implications for Auckland’s housing market.
An increase in supply over demand could relieve pressure in the rental housing market, increasing vacancy levels and putting downward pressure on rents. When combined with rising interest rates this could also put downward pressure on property prices.
Other regions where the supply of new homes exceeded population-driven demand were Canterbury and Otago.
However there were also some regions where supply has fallen short of demand, most notably in the upper North Island in regions such as Northland, Waikato, Bay of Plenty, Gisborne and Hawke's Bay.
In particular, the supply of new homes in the Bay of Plenty has fallen woefully short of the demand created by the region’s population growth.
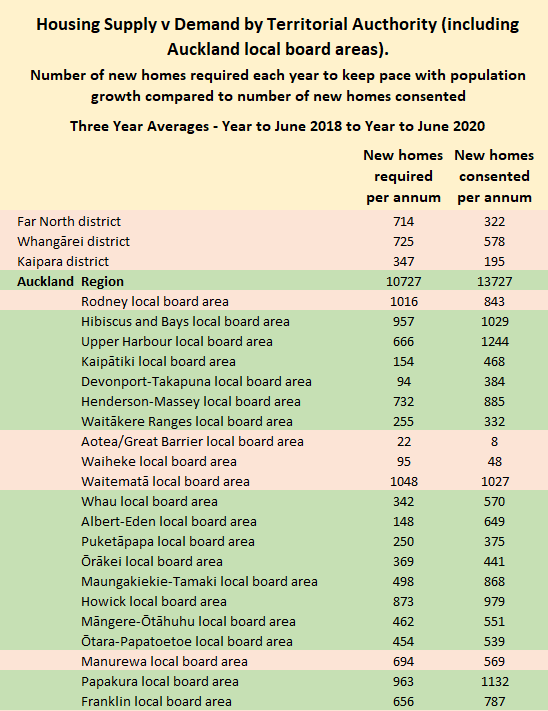
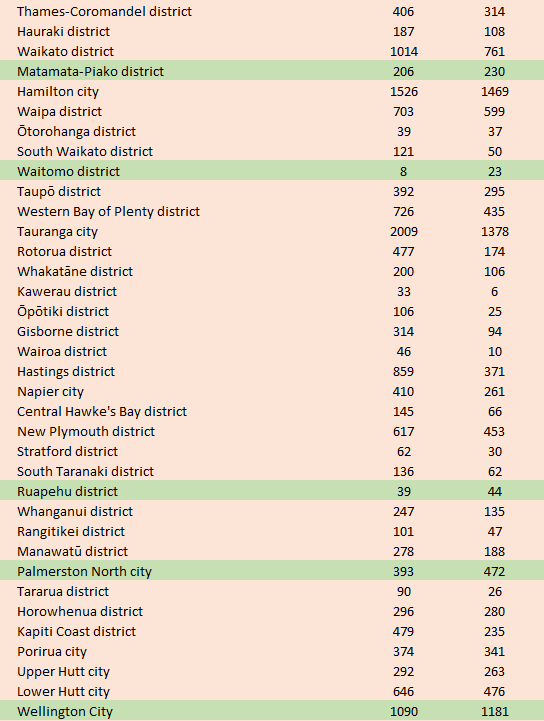
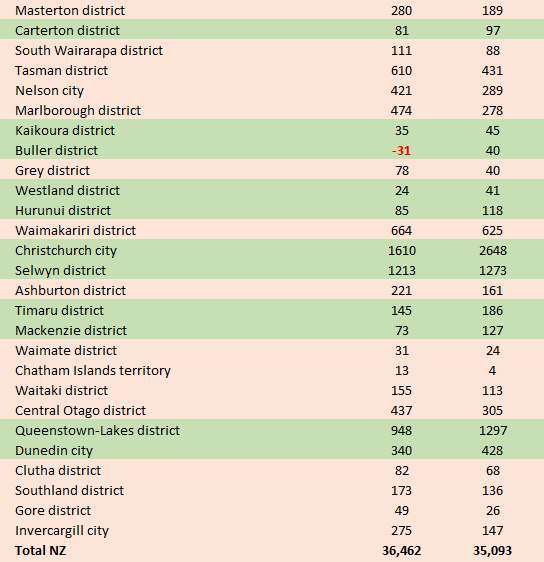
The second table below shows the average annual demand for new housing by territorial authority and Auckland local board area over the three years ending June, from 2018 to 2020, and compares that with the average number of new dwelling consents issued annually in the same areas over the same time period.
It is colour coded, with areas where demand exceeds supply highlighted in pink and those where supply exceeds demand highlighted in green.
What the figures tell us is that there are some areas of the country, most notably Auckland, where the supply of new homes is roughly in balance with the demand created by population growth, while there are other areas where more work needs to be done to boost supply.
The figures also highlight that the pause in migration in place as part of the pandemic response measures has given the housing market some breathing space, allowing a much needed re-adjustment of the housing demand/supply balance.
However, looking forward, that balance is a fine one.
There are not yet any signs that the housing market is entering a period of significant over-supply
If immigration was to resume at the levels that occurred over 2019 and 2020, the balance could easily be tipped back into a shortage and all of the issues associated with that.
So, much will depend on how quickly and by how much the Government opens up the borders to immigrants over the next couple of years.
The comment stream on this story is now closed.
How to measure housing supply and demand
When interest.co.nz set about updating our estimates of housing supply and demand we realised there was no perfect way of doing so.
The demand side figures are based on Statistics NZ population estimates and the household occupancy levels from the 2018 Census.
Although both sets of figures can be regarded as reasonably reliable, they are estimates, not exact figures. But they are probably about as good as it gets for estimating the demand for housing generated by population growth.
The supply side is a bit trickier.
We used building consent figures to estimate supply.
Although consents are also a generally reliable indicator of building activity, not everything that gets consented gets built and construction times can vary significantly.
And some homes may be demolished to make way for new ones, so using building consent figures to determine what was built and when, and how much this adds to the total housing stock, will always involve a margin of error.
An alternative would be to use Code Compliance Certificate figures because CCCs are issued by councils when a building is completed, which should give a more accurate picture of how many homes are actually being built and when.
But some councils are not very good at collecting this information.
Interest.co.nz contacted several councils around the country and asked them for building completion data when compiling this report, to enable building consent figures to be compared to actual completions.
Some, such as Auckland, were able to provide the information in a speedy and efficient manner. Unfortunately the response from others suggested it took a bit of bureaucratic legwork to dig out the data. The implication is that it’s not something that they are looking at routinely, relying instead on building consent data.
Looking at the dwelling completion figures various councils provided us suggests the overall variance between consent numbers and actual completions could be around 5%. But that’s at a time when demand for housing is high and the market has been running hot, making it less likely that a consented project would not proceed.
That could change if conditions deteriorated and the market headed into a downturn.
Councils that aren’t already doing so might like to think about producing timely data on building completions, rather than relying so heavily on building consent figures.
*This article was first published in our email for paying subscribers early on Friday morning. See here for more details and how to subscribe.
We welcome your comments below. If you are not already registered, please register to comment
Remember we welcome robust, respectful and insightful debate. We don't welcome abusive or defamatory comments and will de-register those repeatedly making such comments. Our current comment policy is here.