
Home loan affordability continues to get worse nationally and ended 2012 at its worst level since November 2010.
Interest rates remain low and are virtually unchanged, and the slow rise in take-home pay continues in almost all regions. But it is house prices that are driving the index.
Median house prices reached a record $389,000 at December according to REINZ data, up $34,000 in a year. First quartile house prices reached $270,000, also a record, but only up $15,000 over the year.
In cities where there is a good balance between housing supply and demand, we are not seeing prices rise fiercely. But in those urban centers where supply is constrained, affordability is worsening markedly as the cost of buying a house rises.
Nationally, affordability deteriorated by 3.6% in the year to December 2012. That is, it took 3.6% more of take home pay to afford the mortgage payments for a median priced house, according to the Roost home loan affordability report released today.
This means it cost $39.01 more per week in December 2012 than in December 2011 to make home loan payments on a median priced house.
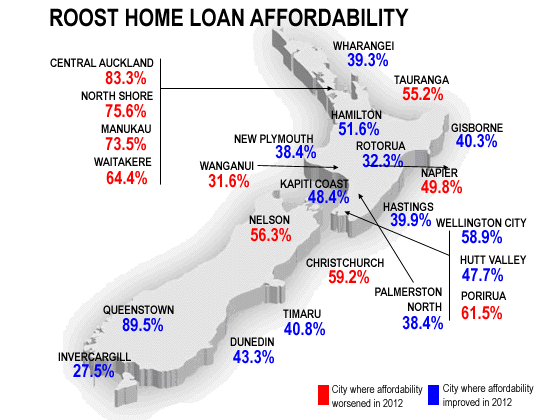
Central Auckland, Manukau, Waitakere, Porirua, and Christchurch all deteriorated quickly over the year, with Porirua making the biggest move, getting worse by 9.5%.
Invercargill, the Kapiti Coast, Rotorua and Hastings all improved their affordability over 2012.
Advertised floating mortgage rates have been unchanged since March last year, but average 6 month and 1 year mortgage rates edged lower by about half a percent over the year.
Median take-home pay for homebuyers in the 30-34 age group – which is after-tax pay – grew by $19.70 per week, almost $1,025 per year during 2012. It grew the most in Wellington City – by $25.07 per week – and the least in Gisborne of $18.63 per week.
-----------------------------------------------------------------------------------------------------------------------
Mortgage choices involve making a significant financial decision so it often pays to get professional advice. A Roost mortgage broker can be contacted by following this link »
-----------------------------------------------------------------------------------------------------------------------
For first home buyers – which in this Roost index are defined as a 25-29 year old who buys a first quartile home – the news is not as bad.
For these buyers outside of the ‘usual suspects’ in Auckland and Queenstown, there have been small improvements in affordability. However, Wanganui, Porirua and Nelson all found housing for first home buyers less affordable as 2012 ended. It was tough in Christchurch as well.
Any level over 40% is considered unaffordable, whereas any level closer to 30% has coincided with increased buyer demand in the past.
For working households, the situation is similar although bringing two incomes to the job of paying for a mortgage makes life considerably easier.
On this basis, 18 of 24 New Zealand cities have a household affordability index below 40% for couples in the 30-34 age group. This household is assumed to have one 5 year old child. Couples in central Auckland, Manukau and Porirua all found it more expensive to pay a mortgage at the end of 2012 than at the beginning, although in almost all other centers the change was minor over the year.
For households in the 25-29 age group (which is assumed to have no children), every city except Queenstown ended the year with the cost of a mortgage lower than 40% of their take-home pay. There was only a marked deterioration in central Auckland; couples in almost all other centers found it no harder to pay the mortgage at the end of the year than at the beginning.
Any level over 30% is considered unaffordable in the longer term for such a household, while any level closer to 20% is seen as attractive and coinciding with strong demand.
Of the 24 cities we monitor, 17 of them had an index below 30% as at December 2012, six were between 30-40% and one (Queenstown) was above 40%.
First home buyer household affordability is measured by calculating the proportion of after tax pay needed by two young median income earners to service an 80% home loan on a first quartile priced house.
| Regional home loan affordability comparison: | ||||||
| mortgage payment as a % of weekly take-home pay | ||||||
|
Dec-12
|
Nov-12
|
Dec-11
|
Dec-10
|
Dec-09
|
Dec-08
|
|
| New Zealand |
56.0%
|
55.3%
|
52.5%
|
55.8%
|
65.2%
|
60.0%
|
| Northland |
48.3%
|
46.3%
|
46.8%
|
51.8%
|
61.7%
|
62.5%
|
| - Whangarei |
39.3%
|
38.5%
|
39.5%
|
45.2%
|
52.6%
|
50.7%
|
| Auckland |
73.3%
|
74.1%
|
68.1%
|
68.4%
|
80.6%
|
75.7%
|
| - Central |
83.3%
|
85.1%
|
75.6%
|
76.8%
|
89.2%
|
77.7%
|
| - North Shore |
75.6%
|
79.2%
|
74.2%
|
75.8%
|
83.7%
|
76.6%
|
| - South |
73.5%
|
70.6%
|
66.9%
|
70.9%
|
82.2%
|
77.3%
|
| - West |
64.4%
|
62.8%
|
59.6%
|
55.6%
|
72.1%
|
68.2%
|
| Waikato/BOP |
48.9%
|
48.8%
|
47.9%
|
53.5%
|
62.2%
|
58.7%
|
| - Hamilton |
51.6%
|
51.2%
|
53.2%
|
55.7%
|
68.3%
|
60.7%
|
| - Tauranga |
55.2%
|
54.3%
|
51.4%
|
66.8%
|
68.0%
|
71.2%
|
| - Rotorua |
32.3%
|
33.4%
|
38.4%
|
37.6%
|
42.1%
|
44.6%
|
| Hawkes Bay |
40.6%
|
44.1%
|
44.9%
|
51.2%
|
59.5%
|
53.8%
|
| - Napier |
49.8%
|
46.1%
|
48.7%
|
56.4%
|
64.1%
|
58.9%
|
| - Hastings |
39.9%
|
46.0%
|
46.1%
|
52.1%
|
62.9%
|
52.7%
|
| - Gisborne |
40.3%
|
45.0%
|
41.2%
|
44.1%
|
57.0%
|
53.7%
|
| Manawatu/Wanganui |
35.5%
|
35.1%
|
34.8%
|
37.5%
|
45.4%
|
44.1%
|
| - Palmerston North |
38.4%
|
40.4%
|
40.4%
|
41.3%
|
48.8%
|
46.1%
|
| - Wanganui |
31.6%
|
27.9%
|
29.2%
|
32.5%
|
44.3%
|
34.2%
|
| Taranaki |
43.0%
|
40.9%
|
45.0%
|
45.7%
|
55.2%
|
51.4%
|
| - New Plymouth |
48.6%
|
48.3%
|
47.4%
|
56.4%
|
67.2%
|
56.0%
|
| Wellington region |
54.3%
|
54.1%
|
53.0%
|
58.6%
|
67.0%
|
62.6%
|
| - City |
58.9%
|
60.3%
|
59.2%
|
65.0%
|
72.1%
|
66.6%
|
| - Hutt Valley |
47.7%
|
47.9%
|
49.8%
|
52.3%
|
59.0%
|
57.3%
|
| - Porirua |
61.5%
|
53.2%
|
51.9%
|
63.3%
|
65.4%
|
67.5%
|
| - Kapiti Coast |
48.4%
|
52.2%
|
53.1%
|
57.6%
|
63.0%
|
59.4%
|
| Nelson/Marlborough |
55.2%
|
51.0%
|
53.5%
|
57.1%
|
68.6%
|
60.2%
|
| - Nelson |
56.3%
|
52.6%
|
50.9%
|
57.6%
|
70.9%
|
54.0%
|
| Canterbury/Westland |
51.9%
|
51.1%
|
49.3%
|
50.4%
|
60.1%
|
56.3%
|
| - Christchurch |
59.2%
|
55.9%
|
54.5%
|
59.1%
|
66.7%
|
61.2%
|
| - Timaru |
40.8%
|
38.9%
|
41.9%
|
39.2%
|
45.3%
|
40.1%
|
| Central Otago Lakes |
70.9%
|
67.0%
|
70.6%
|
69.5%
|
85.6%
|
84.1%
|
| - Queenstown |
89.5%
|
75.2%
|
91.7%
|
74.6%
|
95.2%
|
88.1%
|
| Otago |
39.0%
|
40.7%
|
39.8%
|
40.8%
|
45.5%
|
45.2%
|
| - Dunedin |
43.3%
|
46.6%
|
44.5%
|
46.6%
|
51.6%
|
51.5%
|
| Southland |
28.9%
|
30.4%
|
31.0%
|
31.3%
|
35.7%
|
32.8%
|
| - Invercargill |
27.5%
|
36.1%
|
33.1%
|
32.2%
|
38.6%
|
31.5%
|
Full regional reports are available below:
- New Zealand (159kb .pdf)
- Northland (159kb .pdf)
- Whangarei (159kb .pdf)
- Auckland region (159kb .pdf)
- Auckland Central (159kb .pdf)
- Auckland North Shore (159kb .pdf)
- Auckland South(159kb .pdf)
- Auckland West(159kb .pdf)
- Waikato and Bay of Plenty (159kb .pdf)
- Hamilton (159kb .pdf)
- Tauranga (159kb .pdf)
- Rotorua (159kb .pdf)
- Hawkes Bay and Gisborne (159kb .pdf)
- Napier (159kb .pdf)
- Hastings (159kb .pdf)
- Gisborne (159kb .pdf)
- Taranaki (159kb .pdf)
- New Plymouth (159kb .pdf)
- Manawatu and Wanganui(159kb .pdf)
- Palmerston North(159kb .pdf)
- Wanganui(159kb .pdf)
- Wellington region (159kb .pdf)
- Wellington City (159kb .pdf)
- Wellington Hutt Valley(159kb .pdf)
- Porirua (159kb .pdf)
- Kapiti Coast (159kb .pdf)
- Nelson and Marlborough (159kb .pdf)
- Nelson (159kb .pdf)
- Canterbury (156kb .pdf)
- Christchurch (156kb .pdf)
- Timaru (156kb .pdf)
- Central Otago Lakes (159kb .pdf)
- Queenstown (159kb .pdf)
- Otago (159kb .pdf)
- Dunedin (159kb .pdf)
- Southland (159kb .pdf)
- Invercargill (159kb .pdf)
No chart with that title exists.
We welcome your comments below. If you are not already registered, please register to comment
Remember we welcome robust, respectful and insightful debate. We don't welcome abusive or defamatory comments and will de-register those repeatedly making such comments. Our current comment policy is here.