

A lot of discussion has taken place around the profitability and also the risks of making a single market, in this case China, the predominant driver of export returns - or so it would appear if we believe the media. The reality is somewhat different. The most recent figures I can find from Stats NZ has China being our biggest returner, but apart from forestry, too much?
- 33% of dairy product
- 60% of forestry
- 40% of meat products
- Plus 19% of tourist spending within NZ
All of these are 2019 so pre-Covid-19.
New Zealand has experienced ‘single market failure’ in the past when we were totally reliant on the UK market pre 1939 (WW2) the numbers were:
- 97% butter
- 99% cheese
- 99% sheep meat
This along with wool made up the vast bulk of our exports. By the late 60’s early 70’s the numbers for these products were still very high with:
- 90% butter
- 80% cheese
- 80% lamb (note not sheep meat now)
Where the change had occurred was that total exports to UK now made up only 39% of total exports of which lamb made up 12% less than pre-war but still a sizable chunk.
The weakness of New Zealand’s export policy was exposed and went into meltdown mode when the UK voted to join the EEC in 1973. There had been three or more years of warning bells that this was happening but our ability to diversify into new markets was limited and things happened at a slower pace back then. The issues were magnified by the oil price spike which came shortly after and the combined hit led to the Muldoon government’s attempt to leverage a recovery through the heavy subsidisation of agriculture, which, while pleasant while it lasted, ultimately ended in tears for farmers and Muldoon.
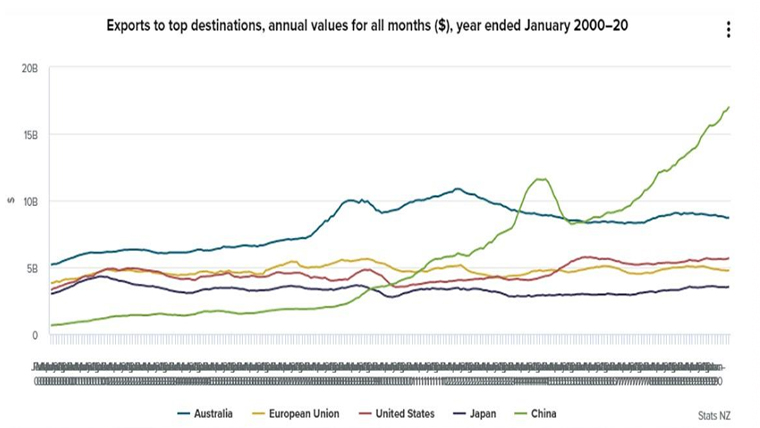
So, the China component which in 2019 made up 28% of export returns (up from 24% in 2018) is in a totally different league to what the perhaps naïve influence the UK market had. What I believe has happened with China is that it is basically the ‘new boy in the block’ relatively speaking and its influence has upset what was the status quo in the supply and demand equation and through rapidly becoming our major market has added another tier of profitability on top of the ‘bar graph’ which wasn’t there before.
The line graph below from 2000 – 2020 clearly illustrates this and shows the recent impact of China on our exports.
Given that the earning capacity of the average Chinese is considerably lower to that of the average westerner, especially those shown as being our major trading partners above. It is perhaps interesting to see how they have managed to elevate themselves into that position. A recent article I came across provided a good summary of this comparison. At the individual level the average Chinese citizen ranks 65th in the world (one behind Mexico) so hardly a position of strength for a trading partner.
However, China is a world of two economies, the Urban and the Rural.
The Rural in 2018 made up 41%, so 59% in Urban cities and growing. Back in 2008 the numbers could have been quite tidily reversed. Not surprisingly, the area of China that New Zealand exporters are concerned with is Urban China and 59% of a population of 1.4 billion still makes more than 800 million. To put this into context the EU (the next largest population block) currently has around 446 million and even with the 66 million from the UK added still falls considerably short.
When the urban sector alone is studied, then the China earning capacity and more importantly spending capacity takes on a whole different picture. As with many Asian cultures, Chinese are good savers, although this aspect appears to have weakened with the younger generations. Along with saving, the Chinese have accumulated considerable wealth. This is largely due to the Chinese government decision to privatise the then state owned housing stock in the late 1990’s and most Chinese “were able to buy their homes and apartments at rates that are a fraction of what they are today”. So, when it comes to comparing household debt in China to that of the USA, 57% of Chinese have debt compared to 77% of the USA and of that debt only makes up 16% of assets compared to 36% of the USA. 96% of Chinese own their own homes with 31% owning two more apartments. (I’m not quite sure who lives in these given everybody owns their own house, perhaps the kids??) So, the end result of all this household ownership is that what someone earns has less effect on their spending when you have this degree of wealth behind them and little debt or rent to service. “In fact, China's median urban household net worth stood at US$198,330 at the end of 2019, versus an estimated US$104,000 in the US.”
As my wife, who spent time in China teaching in the outer region, said to me, there is plenty of poverty still in China and so these numbers could convey a false picture of it. However, New Zealand’s focus is on the cities and the wealthier sectors within them.
So, diversifying into other markets is always obviously important but we should not lose sight of just how and perhaps more importantly why China is so important to our returns and how they have managed to achieve that. So long as the fundamental components of why China has ended up being our major trading partner remains sound - so long as this component of our total trading mix remains in balance, and I would argue that currently it still is.
I believe we should be cautious before throwing the China baby out with the bath water. A reminder of the importance of the China influence is what has happened to the venison and wool industries which at least in part can show what can happen when China no longer plays an integral part in their supply chain.
We welcome your comments below. If you are not already registered, please register to comment
Remember we welcome robust, respectful and insightful debate. We don't welcome abusive or defamatory comments and will de-register those repeatedly making such comments. Our current comment policy is here.