
The news front the last week has been eventful; the Queen ‘passing on’, Ukraine kicking the Russians butts at least for now, and we have moved into a major ‘post pandemic’ stage with masks no longer mandatory in many situations.
However, since the positive turnaround of the last GDT not a lot has happened to highlight in the rural sector. So, it is timely to have a look and see what is occurring with rural debt.
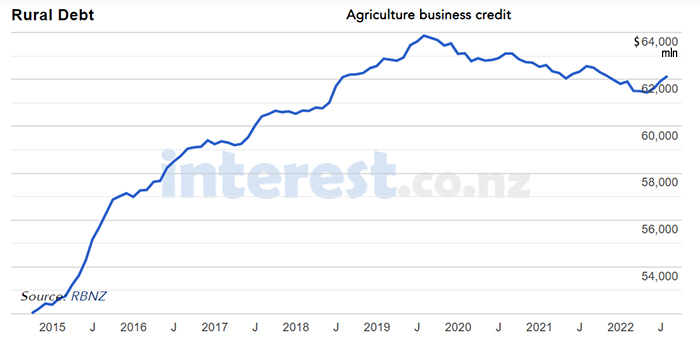
Looking at the interest.co.nz chart of Reserve Bank (RBNZ) data shows the trend over all agricultural sectors for the last seven years (and beyond) and for the last couple of years we can see a gentle decline (last 6 months it has reversed again).
Looking at the RBNZ summary of the nation's debt and at the specific agricultural sectors makes a bit more interesting viewing, bearing in mind the graph here dates back to April numbers. It shows that while all agriculture has reduced borrowing in the last 3-plus years, the lift in the last 6 months is confined to the horticultural sector with dairy actually leading sheep and beef in their reduction in bank borrowing.
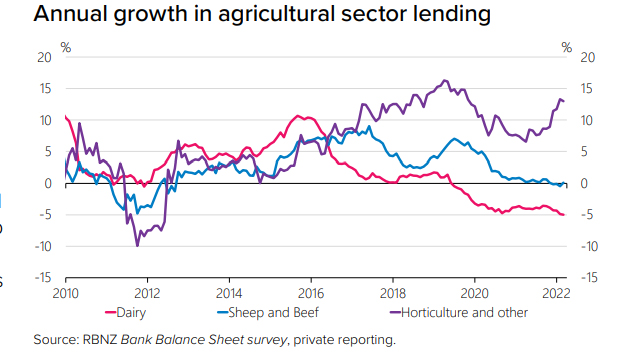
Two reasons why dairy borrowing and subsequent debt have reduced for dairy are:
- The greatly reduced number of dairy conversions that have occurred in the last 5 to 6 years due the constraints/regulations with water and nitrate emissions that are in place in many regions. Cow numbers have reduced by approximately 300,000 since ‘peak cow’ and the number of herds (farms) have also reduced with a reduction in the number of herds by 193 between the 2018/19 season and the 2019/20 season (farm size per hectare has increased from 139ha in 2010 to 155 in 2012 so amalgamations have been taking place although there was no change in the last couple of years.
- The second reason that lending has decreased is the better cashflow situation most dairy farmers have found themselves in with the lift in farmgate MS prices. An observation, now that costs per MS are now said to be running at about $8.18 how dairy farmers managed to stay profitable in the past either says something about the constraints they put on themselves then or how the purse strings have loosened up now (increases in interest rates aside), probably a bit of both.
| $/kgMS |
$4.65 |
$4.30 |
$6.52 |
$6.79 |
$6.35 |
$7.19 |
$7.74 |
$9.50 |
|
Year |
2015 |
2016 |
2017 |
2018 |
2019 |
2020 |
2021 |
2022 |
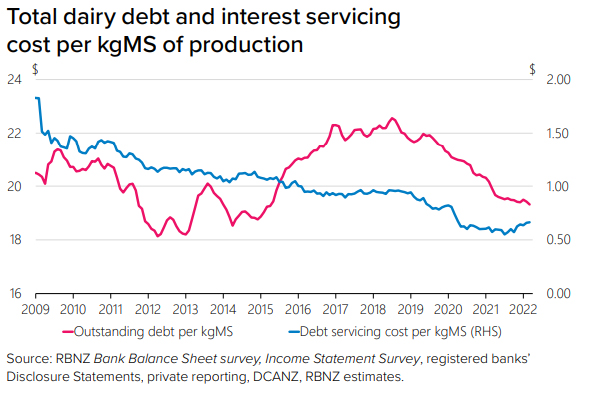
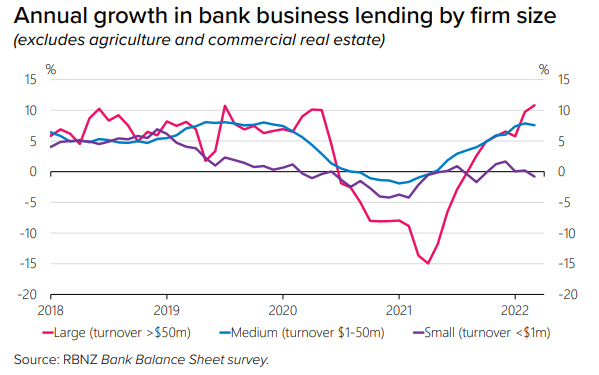
When comparing the above graphs to what is happening in the non-agricultural sectors the impact of the pandemic on the non-ag sector becomes glaringly obvious. Firms look to have retrenched initially to try and ride out the impacts and then perhaps when it became obvious the pandemic was not going to be an overnight phenomenon made up for lost time with a steep return back to more normal patterns.
The lack of any real movement either way by the SME’s (<$1m turnover) perhaps reflects the difficulty this sector can have in getting loans and also shows why productivity for this segment of the economy has been very low, for a supposed lack of investment in new technologies - perhaps showing a business would rather fold with a small debt than a large one.
Sheep and beef farming have been generally reducing debt with a similar pattern to dairy but at lesser levels, which given the record prices being achieved for most red meat products is perhaps a little surprising it hasn’t been at greater levels. It may reflect the poor contribution wool continues to make to the farm balance sheet and the fact that at any one time there is often a region affected by drought.
There is generally a greater financial conservatism in the sheep and beef industry and also the older age of farm owners may also be a contributing factor. I.e. less time left in the industry to enjoy the fruits of new investments.
Looking to the future it may be that climate extremes are what are going to have as the greatest impact upon all sectors profitability and debt levels.
Product prices are likely to remain firm-to-good, but the great unknown will be the impact of climate. NIWA have been predicting a La Nina pattern for this coming summer. In my experience of East Coast farming this has been preferable to a El Nino pattern, with less chance of drought (except for the western and southern South Island) but of late it has been bringing with it heavy rain events and plenty of infrastructure damage requiring essential spending be-it by insurance companies, local and national government and the private individual, in this case farmers.
This could also mean that for consumers, vegetables and perhaps some fruit production may be affected, and prices may not enjoy the seasonal drop-off in prices that normally would be expected in the warmer months.
MPI obviously had some concerns in the pandemic about farm debt as the “Farm Debt Mediation Scheme” was introduced in July 2020 “designed to help financially distressed farmers by providing an independent, constructive and timely process for them to work through debt problems”. Farmers who decide to access the service share the costs with the finance provider(s) but only up to a $2,000 share with the maximum expected cost of mediation topped at $6,000. Given the financial strength of the rural economy at the moment it is not expected that there are many farmers using the scheme. However, even in good times financial woes can occur especially when climate extremes take place.
We welcome your comments below. If you are not already registered, please register to comment
Remember we welcome robust, respectful and insightful debate. We don't welcome abusive or defamatory comments and will de-register those repeatedly making such comments. Our current comment policy is here.