
Back in July 2020 some may remember that the Government released its aspirational plan to lift agricultural returns to help the whole of New Zealand’s economic recovery.
Given what has transpired over the last 2-3 years people could be excused for forgetting or overlooking that this even took place. However, 2 years on the Government has released an update. Initially it is perhaps worth a look back and remind ourselves what the plan was. Called “Fit for a Better World – Accelerating our Economic Potential, a 10-year roadmap to unlock greater value for a sector vital to New Zealand’s economic recovery”. The aspirational outcomes of the plan are based around three main themes:
- Productivity: adding an additional $44 bln in export earnings over the next decade through a focus on creating value.
- Inclusiveness: employing 10% more New Zealanders from all walks of life in the food and fibre sector by 2030, and 10,000 more New Zealanders in the primary sector workforce over the next four years.
- Sustainability: reducing our biogenic methane emissions to 24-47% below 2017 levels by 2050; and 10% below by 2030. Plus restoring New Zealand’s freshwater environments to a healthy state within a generation.
So, to the recent update; the MPI document is an impressive 60 pages, so somebody has been diligent. While the initial document was published post the start of the Covid pandemic no doubt much of the planning had occurred before March 2020 and so it would have been difficult to incorporate its impact into the early years results. Despite this agriculture has done pretty well through the pandemic although high value seafoods and horticultural products were affected by logistic issues and the lack of available labour.
Something that is lacking and given the recent events is a caveat on the value of the New Zealand dollar on either the UD$ or the TWI. The 20% or so decrease in the NZ$ against the US$ in the last 6 months or so is probably having as greater influence than any innovation occurring within New Zealand and even hedging gets caught up with at some point.
So, while it is early days to compare where we are versus where we need to be we do have forecasts out to 2026 compliments of the Situation and Outlook for Primary Industries (SOPI) which came out in July. While the year ending June 2022 was a record year on returns to get the $44 bln gain by 2030 (and to be clear that is an additional $44 bln over the 10 years up to and including 2030 taking that years total up $93.7 bln) it requires an average annual increase over the previous year of approximately 6.6% compounding over the 10 years and is shown by the green line below. Because it is a modelled return there is the flat straight equally attributed gains each year.
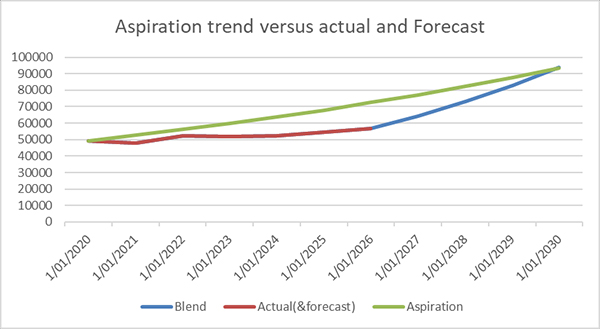
Source: Data from SOPI
The blue line leads on from the red which shows the actual and forecasted returns (SOPI) and which was increasingly falling behind the average gains from the aspirational line. To make up the lost ground from when the forecasted returns cease in 2026 requires annual gains of approximately 13.35% increases per year. Possible, but exceeding anything that (according to SOPI data) not close to being achieved for any period in the last 20 years. As can be seen below there have been periods when increases in excess of 13.35% have been achieved but only for short periods and prolonged improvements have been shown to be elusive.
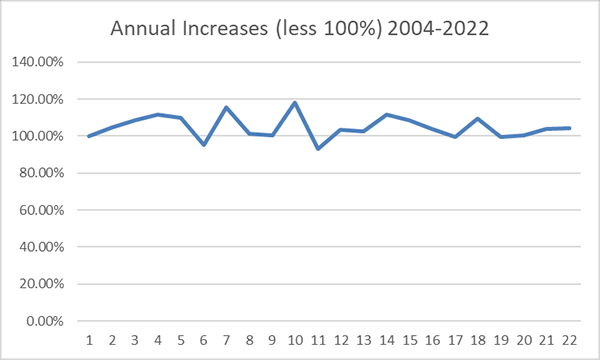
Source: Using SOPI data
This is not surprising given that most of the primary industries operate in an environment which is highly prone to the vagaries of weather, which are likely to increase, as well as the global impacts upon commodities exports which the biggest numbers are generated by.
While the measures to gauge the success of the programme include other areas than (just) financial. All are arguably underpinned by that measure. At the moment given that most the financial data of the actual graph line is in the form of forecasts and therefore likely to be wrong, (However, that can go both ways.) not too much can be read in the numbers but the longer the sector operates below the optimal numbers to get to the magic $44b the harder it will be to catch up. It would be interesting to see what the different ‘parts’ are that make up the $44b. Presumably this doesn’t include credits from carbon forestry that can hardly be considered “productive” improvement.
Looking at the other indicators, on the surface increasing the Primary sector work force by 10% by 2030 (from 2020) sounds more achievable and starting with 2019 figures there were 366,807 employed and there had been a 9% increase since 2012. Currently 2022 numbers are not accurately available. Sustainability, especially the areas of water quality and GHG emissions are a work in progress and the -10% reduction in methane emissions on 2017 numbers by 2030 is not going to be an easy outcome.
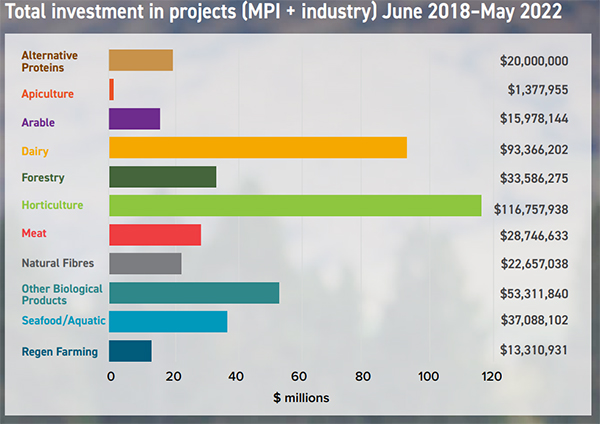
Much of the “Fit for a Better World” document is around the inputs that have are going into the different sectors with little in specifics in the way of outcomes. These have been significant with: MPI Funding of $207,450,171 and Food & Fibre sector Funding of $228,730,887.
What outputs there are, mainly focus on positive case studies with the financial results yet to come. Hopefully not another case of the rhetoric not being met by the reality.
10 Comments
If we export 1 kg of woodfibre as a log to China we receive 27 -29 cents for it. If we convert that 1 kg woodfibre to pulp we get between 1.40 and 2.00 dollar for it. As a finished product like corrugated box or as carton board we can make 3.70 dollar for it. If we really go wild and start making nanocellulose of that 1 kg of woodfibre we could receive up to 10,000.00 dollar a kg for it depending on how pure your nanocellulose is. So why are we leading in exports of logs but not in exporting value through added value of pulp/paper products?
If you receive a cardboard box from overseas it will have several stamps on it certifying its sustainable source etc. We promote our meat and milk as pure nz etc , maybe its time we did so with our timber. I'm sure people would buy something percieved as form Clean NZ, at a premium .
Peter M,
These are good questions. But there are plenty of smart people in the timber industry, and using pulp as the example our pulp industry has declined. So a starting hypothesis is that the added value added even more cost.
KeithW
And scale: NZ is a pimple on a flea on a big dawg as a percentage of international market size.
And regulatory uncertainty: Ardern's 'captain's call' on gas and oil upended investors' view of the long term stability of the investing environment. Processing, at the scale necessary to achieve the sort of returns so enthusiastically noted in the OP, is a multi-decadal exercise. Sorry, but investors simply won't fund that given the recent track record. And NZ is a notoriously thin domestic capital market, so it's offshore interest which has to be enticed. Enticed, they ain't....
All the more reason to go niche and upmarket .
As far as the oil and gas goes , thats bollocks . They wern't investing in the permits they had anyway , and its nothing to do with overall investment in NZ. Those "dirty investors are going to find it harder and harder to find something to invest in, worldwide. Most of them are moving away form fossil fuel portfolios anyway .
The Govt can't fix our rooted roads, let alone manage a roadmap.
Everything they touch turns to crap!
Pull your finger out and do something about it then .
Farmers have in the past, graded gravel roads when councils have been slow to. But a grader is unlikely to sort this road out. https://www.odt.co.nz/regions/west-coast/jackson-bay-road-could-be-aban…
We used to live at the end of a council maintained road. They put a sign up to say the road wasn't maintained by the council past that point .
So we made our road past that point way better than the council part.
Some roads won't be economic to reinstate. Will bring up some interesting questions as to what obligations councils have to maintain access to private property.
Hey, I retain my RWT license and cut my teeth on them old Cat knucklebasher graders..and our alluvial pluvial rivers just keep feeding us gravel for the road metal plants I used to feed. Takers??
Might have to forego sealed surfaces, speed, fast transit times, and accept swingeing freight cost inflation, but omelets, eggs, trade-offs....
We welcome your comments below. If you are not already registered, please register to comment
Remember we welcome robust, respectful and insightful debate. We don't welcome abusive or defamatory comments and will de-register those repeatedly making such comments. Our current comment policy is here.