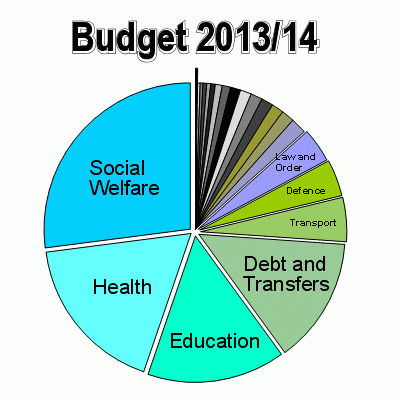
This table outlines the New Zealand Government's planned spending for the 2013/14 budget year.
Actual spending for the previous four years is on the left.
The numbers are drawn together from data released by the Minister of Finance on May 16, 2013.
Links to the primary sources used, from Treasury's website, can be found at the bottom of the page.
Click on any heading to drill down to what makes up these numbers.
Figures for each allocation are in millions of NZ$.
|
Actual 2009/10 |
Actual 2010/11 |
Actual 2011/12 |
Actual 2012/13 |
Budget 2013/14 |
% | |
| NZ$m | NZ$m | NZ$m | NZ$m | NZ$m | ||
| 618.0 | 2,286.1 | Cant. Earthquake Authority | 260.4 | 0.3% | ||
| 113.8 | 123.7 | 120.8 | Industrial relations | |||
| 158.5 | Veterans Affairs - Defence | |||||
| 208.4 | 215.9 | 208.1 | Immigration | |||
| 479.4 | 1,577.2 | 945.2 | 235.0 | Energy | 196.2 | 0.2% |
| 194.1 | 219.2 | 218.2 | 214.4 | Special Interests | 233.9 | 0.3% |
| 49.4 | 272.0 | 179.7 | 343.5 | Communications | 334.3 | 0.4% |
| 459.3 | 489.5 | 380.4 | 398.1 | Arts & Culture | 362.8 | 0.4% |
| 334.6 | 412.8 | 457.7 | 498.7 | Treaty of Waitangi | 422.6 | 0.5% |
| 900.6 | Primary Industry | 1,087.9 | 1.3% | |||
| 737.6 | 789.1 | 776.5 | 800.3 | Science & Research | 927.3 | 1.1% |
| 663.4 | Economic Development | 626.2 | 0.8% | |||
| 1,075.3 | 1,618.2 | 1,019.9 | 1,085.3 | Housing | 1,112.4 | 1.3% |
| 962.0 | 997.0 | 1,013.7 | 940.0 | Foreign Policy | 1,072.1 | 1.3% |
| 1,000.2 | 1,157.4 | 1.275.5 | 1,070.9 | Government | 1,027.1 | 1.2% |
| 814.6 | 897.0 | 887.7 | 947.7 | Environment | 773.2 | 0.9% |
| 1,449.1 | Labour | 1,448.8 | 1.7% | |||
| 964.5 | 1,072.5 | 1,019.7 | Industry | |||
| 1,194.9 | 1,197.1 | 1,190.0 | 1,165.2 | Justice | 1,188.4 | 1.4% |
| 2,858.6 | 3,007.3 | 2,882.2 | 2,983.0 | Law & Order | 3,140.8 | 3.8% |
| 3,299.9 | 3,078.5 | 3,039.0 | 2,825.4 | Defence | 3,354.6 | 4.1% |
| 3,490.5 | 3,479.1 | 3,911.4 | 3,726.9 | Transport | 4,046.2 | 4.9% |
| 11,719.6 | 13,568.4 | 10,841.7 | 11,559.5 | Customs, Finance & Tfr's | 11,502.8 | 13.9% |
| 11,770.4 | 12,078.8 | 12,028.1 | 12,406.6 | Education | 12,644.5 | 15.3% |
| 12,722.2 | 13,329.3 | 13,613.0 | 13,983.1 | Health | 14,655.0 | 17.7% |
| 21,718.3 | 22,807.0 | 22,872.6 | 21,522.8 | Social Welfare | 22,399.4 | 27.0% |
| ====== | ====== | ====== | ====== | ================= | ====== | ------ |
| $76,053.8 | $78,944.4 | $79,499.1 | $82,163.9 | Total Expenditure | $82,817.1 | 100.0 |
| $191,798 | $200,234 | $208,467 | $213,844 | GDP (nominal, per RBNZ) | $227,892 | E |
| 39.7% | 39.4% | 38.1% | 38.4% | Govt spending - % of GDP | 36.3% | E |
| and this compares with taxes collected as follows: | ||||||
| $55,899.4 | $58,189.5 | $62,100.6 | $65,383.9 | Total tax collected | $69,651.9 | |
| (click on this link for details) | ||||||
| Not all the difference between tax collected and expenditure needs to be borrowed. The Crown has other sources of revenue than tax. The biggest single reason is that significant portions of National Super payments are pre-funded in the Super Fund. | ||||||
Sources: You can download the data behind these tables from the Treasury website here »
1 Comments
Craig,
Thanks for posting all this data.
I note your summary line:
Not all the difference between tax collected and expenditure needs to be borrowed.
The following link debunks the idea that it all must be borrowed; or at least notes that it can be borrowed from yourself as the government.
http://www.mediaroots.org/can-the-usa-really-run-out-of-dollars/
So we should absolutely look at each budget line, and decide whether that is an efficient and sensible use of the country's resources. But balancing isn't necessarily the first priority.
The paper points out an economic truism that a government deficit must equal a private surplus, minus the leakage offshore in the current account.
This equation tells us that in New Zealand, if we have a fiscal deficit of roughly $12 billion; and a current account deficit also of roughly $12billion, the private balance must be about zero. If we reduce the government deficit to zero, while leaving the current account at negative $12 billion, then privately there has to be dissaving of $12 billion.
If we are serious about deficits as a country, then, the one to go after is the current account. All of the current National government settings are about increasing the current account deficit. It's the single biggest reason they need to change.
The paper has the following quote:
“Mark Twain said, ‘It ain’t what you don’t know that gets you into trouble. It’s what you know for sure that just aint so.’
I actually quite like Bill English. But he "knows stuff that just ain't so". And that's getting us all into lots of trouble.
We welcome your comments below. If you are not already registered, please register to comment
Remember we welcome robust, respectful and insightful debate. We don't welcome abusive or defamatory comments and will de-register those repeatedly making such comments. Our current comment policy is here.