

 By Roger J Kerr
The consolidation of US 10-year Treasury bond yields in the 2.55% to 2.75% over recent days is very instructive to the future direction of long-term interest rates.
Whereas the US dollar value recoiled (weakening from recent strength) in the markets last week following US Federal Reserve boss Ben Bernanke’s belated hosing down of tapering timing, the US bond market did not unwind the selling that has sent yields up to 2.60% from 1.60%.
The US bond market is pricing in a future environment of eventual higher inflation, higher growth and high short-term interest rates and will continue to do so.
Those large borrowers hoping for a pullback in long-term swap yields to execute fixing of rates they should have done months ago, look likely to miss out again.
Having climbed to above 4.0% in June/July from 3.25% in May our five year swap rates now appear set to remain solidly above 4.00% over coming years.
Long-term yields can only reverse back downwards if fixed interest investors buy aggressively in the belief that future inflation and growth will be low and the Fed will keep QE forever and a day. Very difficult to see that happening, therefore the only debate is the timing of interest rate increases and where 5-year swap rates will locate their new average levels post GFC and post QE. An average somewhere in the vicinity of 5.00% would be my view.
The interest rate market’s attention will however be focused on the short-end of the yield curve this week with the release of the June quarter’s Consumer Price Index.
Do not be persuaded by the arguments that as inflation results have been lower than forecast over recent quarters and the annual rate of 0.8% is below the 1% to 3% RBNZ target band the RBNZ will be hesitant about increasing the OCR. That is a very short term view and one prone to abrupt change when the following storm clouds on the inflation horizon are viewed:
· Tradable inflation (imported goods) is set to increase with the Kiwi dollar now trading below 0.8000. The decrease in tradable inflation that has disguised sticky non-tradable inflation over recent years due to the high currency value has come to an end. It takes six to none months for importer’s currency hedging to run through, therefore look for increases in tradable inflation in the December 2013 and March 2014 quarters.
· House building costs and rents are only going one way over the next 12 months.
· Petrol pump prices are being double-whammied by rising crude oil prices and a lower NZ dollar value.
· Food prices will also be moving higher due to the lower NZ dollar value (think imported bananas) and dairy products remaining at elevated levels.
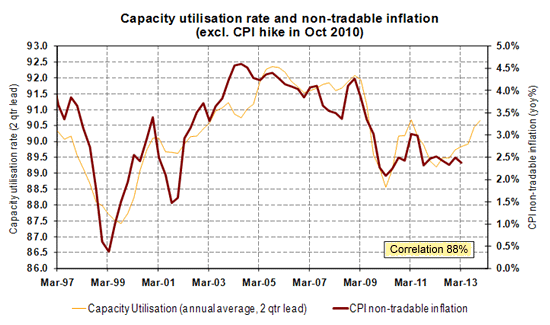
· Capacity utilisation in the economy is well above 90.0% and there is a strong historical correlation between capacity utilisation and non-tradable inflation (domestic prices unrelated to the exchange rate), Refer chart below.
I just hope the RBNZ econometric model is accurately forecasting the clear increases in both tradable and non-tradable inflation over the next 12 months.
-----------------------------------------------------------
To subscribe to our daily Currency Rate Sheet email, enter your email address here.
Roger J Kerr is a partner at PwC. He specialises in fixed interest securities and is a commentator on economics and markets. More commentary and useful information on fixed interest investing can be found at rogeradvice.com
We welcome your comments below. If you are not already registered, please register to comment
Remember we welcome robust, respectful and insightful debate. We don't welcome abusive or defamatory comments and will de-register those repeatedly making such comments. Our current comment policy is here.