
By Daniel Hynes and Soni Kumari*
Highlights
• Gold remains vulnerable to further moves lower amid rising rates and a stronger USD.
• Haven demand remains subdued despite the rising geopolitical risks and worsening economic backdrop.
• Technically, the bearish trend is likely to continue. The break below USD1,675/oz suggests the price could fall to USD1,600/oz..
Outlook
The macroeconomic backdrop remains challenging. The Fed made it clear that it is leaning toward doing too much tightening rather than too little. With inflation stubbornly high, interest rate hikes will be aggressive.
This will also lead to further US dollar strength, aided by weakness in the EUR as economic conditions worsen. Deteriorating liquidity and higher US yields will feed haven flows and add to the risk premium.
Rising geopolitical and economic risks are doing little to entice safe haven buying, with the USD still the asset of choice. Nevertheless, the risk of either stagflation or outright recession could ultimately turn this around. Gold has traditionally outperformed in such environments.
This doesn’t bode well for investment demand in the short term. Speculative futures positions have dropped significantly and still have room to decline. Investors are liquidating exchange traded funds (ETF), with August flows dropping by 45t. Fund flows have nearly given up this year’s net flows of 281t till April.
We see further downside in the short term. We have cut our short term (0-3mth) target to USD1,600/oz.
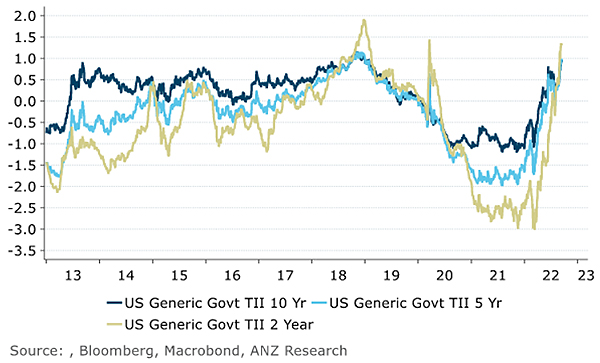
US Benchmark real yields
Q&A
Can gold withstand an aggressive rate hike cycle?
The gold price has fallen steadily since March, as central banks indicate tighter monetary policies for the rest of the year. Higher than expected inflation and a strong US labour market raised expectations for the next Fed rate hike to be 75-100bp, leading gold to drop below USD1,700/oz.US real yields jumped in Q3 and are on firm footing, given the Fed’s hawkish stance. Rising rates increase the opportunity cost for holding non-yielding assets like gold. That’s not to say gold can’t perform in such environments. Since 1970, the positive correlation with rates has been about 28% and is not considered significant. When broken down into rate-hike cycles, gold has only finished lower once. In fact, some periods have seen gold rise 30–40% higher.
What has changed in last one month?
We now think USD strengthwilllast longer than we had thought. Labour resilience means the Fed will have to hike further than the market is expecting. Deteriorating liquidity conditions and higher US yields will feed haven flows and add risk premium.Europefaces a seriousenergy crisis, which is a headwind for EURand a support for the USD. This makes us thinks the USD willpeak in Q1 2023. In the face of sustained dollarstrength, we see gold continuingto underperform.
How is investor positioning looking?
Investors have become more bearish in response to hawkish central banks and the strong USD. Speculative long positions have dropped to 2019 lows(Figure 14). We see room for selling if the Fed continues its aggressive rate hike cycle. Short positions are relatively small compared to 2018 highs. A 100bp hike at the next Fed meeting could see fresh shorts added. ETF holdings are showing similar trend. Outflows rose to 45t in August and accelerated in September. Net inflows (ytd) narrowed to 36t from 281t in April.
What could support gold?
With many countries battling inflation, rising interest rates could slow economic growth. The rising risk of a protracted recession could revive haven demand. If the Fed turns dovish and inflation remains high, this could keep real rates low and supportive for gold prices. Deteriorating geopolitics could also be potential tailwind.
What is gold’s fair value?
Gold tends to be driven by interest rates, inflation expectations and the USD. We combined these factors into a model based on a zero-coupon inflation-adjusted US Treasury bond.
Our fair-value model suggests the price is USD600/oz too high. This is based on 30y break-even bond yields of 2.33%, 30y bond yield of 3.46% and the DXY at 109.73 spread. This premium can be driven by exogenous forces such as equity market flows and geopolitical risks. The Nasdaq has steadily fallen since hitting a high of 16,000 in late 2021 and is down 27% ytd. This is likely providing some support alongside rising geopolitical risks. But that support could disappear if these factors dissipate.
Can silver continue to outperform gold?
Physical demand for silver is picking up, as the major consuming markets in India and China import more. Industrial demand for silver is holding up well from the solar sector, while jewelery demand is also gaining attention. That said, silver largely tracks gold and gold’s weaker backdrop doesn’t bode well. Its outperformance against gold could be possible as short positions in silver look stretched. So, any short covering could provide another opportunity for silver to fare better than gold.
Technical
Key supports have broken
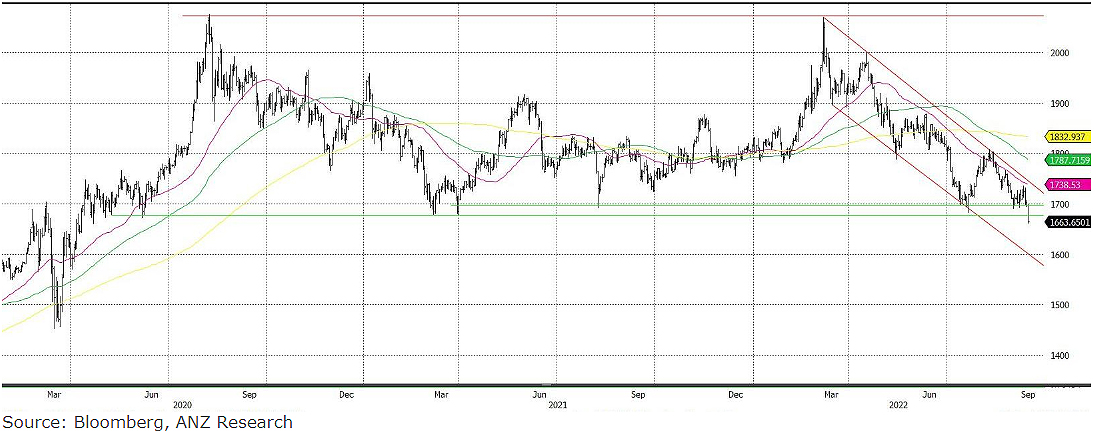
The gold price failed to break above USD1,800/oz in August, with the downtrend continuing.
Key supports of USD1,700 and USD1,675 have been broken. A weekly close below USD1,675/oz could trigger a heavy sell-off next week. That said, the price could consolidate after Thursday’s sell-off, ahead of the FOMC meeting on 21 September. Bears could extend downside price moves to USD1,600/oz and below.
On the other hand, immediate resistance lies at USD1,700/oz, and a break of this level would put the next resistance point at USD1,735/oz. While reversal of the trend could be possible if prices break critical level of USD1,800/oz.
Figure 1. Gold daily technical chart
Daniel Hynes and Soni Kumari are commodity strategists at ANZ. This article is a re-post from ANZ and is here with permission.
![]() Our free weekly precious metals email brings you weekly news of interest to precious metals investors, plus a comprehensive list of gold and silver buy and sell prices.
Our free weekly precious metals email brings you weekly news of interest to precious metals investors, plus a comprehensive list of gold and silver buy and sell prices.
To subscribe to our weekly precious metals email, enter your email address here. It's free.
Comparative pricing
You can find our independent comparative pricing for bullion, coins, and used 'scrap' in both US dollars and New Zealand dollars which are updated on a daily basis here »
Precious metals
Select chart tabs
3 Comments
Commentators still seem so split on the path for interest rates and when/if the Fed will pivot. So my plan remains to bet on the usual trend this late in the cycle - desperate govts/bankers inflating money supply to worthlessness. It's the only thing I have high trust in them delivering.
So yeah, holding onto my gold, and happily paying my rising opportunity cost as rates rise.
Money Correlations - nominal, Money Correlations - real
Daily Treasury Real Yield Curve Rates
This is the phenomenon we study. Financial repression (FR) is defined in Box 1, while Table 1 describes a selection of policies that defined the FR era in the United States but are representative for other countries, advanced and emerging alike. There is considerable cross country variation in the extent of financial repression and the magnitude of the financial repression tax. When controlled nominal interest rates coupled with inflation produce negative real interest rates, it liquidates (reduces) the stock of outstanding debt; we refer to this as the liquidation effect. However, even in years when real interest rates are positive, to the extent that these are kept lower than they otherwise would be via interest rate ceilings, large scale official intervention, or other regulations and policies, there is a saving in interest expense to the government. These savings are sometimes referred to as the financial repression tax. Link
I would be drug testing all those commodities analysts that concluded the price of gold is US$600 overvalued at its current price. Last time Gold made some real noise was during/after the GFC ,forgive me for thinking we could be facing a similar scenario. Throw in the speculative notion some hold that the price of Gold has been manipulated (down) rather consistently for no short period of time. The odds of Gold falling a further USD $600 an ounce anytime soon seems highly unlikely to me given it has already lost ground from earlier in the year. My guess is if it is gonna keep trending down maybe a further USD200 slide ..but thats a very big maybe. If the sharemarket wobbles Gold might find some traction.
We welcome your comments below. If you are not already registered, please register to comment
Remember we welcome robust, respectful and insightful debate. We don't welcome abusive or defamatory comments and will de-register those repeatedly making such comments. Our current comment policy is here.