


While we await the final results of last weekend's general election, this month's Home Loan Affordability Report looks at how housing affordability changed under both the previous Labour and National-led governments.
The report has been tracking the monthly movements in the main measures of affordability such as housing prices, incomes and mortgage interest rates since 2004, and how these affect the ability of first home buyers to purchase a home of their own.
This month we take a look at how those measures changed over the six years from September 2011 to September 2017, when a National-led government was at the helm, and then how affordability fared from September 2017 to September 2023 under a Labour-led government.
September 2011 to September 2017
John Key was Prime Minister for most of this time with Bill English taking over that role in 2016.
Although this was a National Government it was supported by confidence and supply agreements with ACT, United Future and the Maori Party and for its first three years even had a memorandum of understanding with the Greens.
The first thing to look at from this period is the movement in house prices, particularly the lower quartile dwelling price, which represents the bottom end of the market which is the entry point for first home buyers.
From September 2011 to September 2017, the REINZ's national lower quartile selling price increased from $247,000 to $350,000, up 42% over the six years.
However the real action was in the country's largest housing market - Auckland - where the REINZ's lower quartile price increased from $345,000 to $650,160 over the same period, up a whopping 88%.
So there was reasonably strong house price inflation over those six years with extremely strong house price inflation in Auckland.
What about incomes?
The Home Loan Affordability Report tracks the median after-tax pay for couples aged 25-29 working full time, as a proxy for the incomes of likely first home buyers.
At the national level, in September 2011 this would have given a couple a combined after-tax income of $1411 a week, rising to $1578 in September 2017, up 12% over six years.
In Auckland wages were slightly higher but the rate of increase was slightly less, rising from $1462 a week to $1609 over the same period, an increase of just 10%.
So the increase in house prices greatly exceeded the increase in wages for likely first home buyers during the six years from September 2011 to September 2017.
In September 2011 the average of the two year fixed mortgage rates offered by the major banks was 6.39% and by September 2017 that had declined to 4.70%.
This was a double-edged sword in that although it would assist with mortgage payments it was probably also a significant factor in the increase in house prices over that period.
So how did all of those factors affect overall affordability for first home buyers?
In September 2011 the mortgage payments on a home purchased at the national lower quartile price of $247,000 would have been $285 a week, assuming it was purchased with a 20% deposit.
That would have eaten up about 20% of a typical first home buying couple's after-tax pay.
In Auckland the mortgage payments on a lower quartile-priced home bought with a 20% deposit would have been around $398 a week, equivalent to 27% of a typical first home buying couple's take home pay.
The threshold for mortgage payments being considered unaffordable is when they take up more than 40% of take home pay, so by that measure, buying a home of their own should have been well within reach for most people on average wages in 2011, even in Auckland.
By September 2017 things hadn't changed much at the national level.
The mortgage payments for a home purchased at the national lower quartile price had increased to $335 a week, equivalent to about 21% of of a typical first home buying couple's take home pay - still very affordable.
But things had become a lot more difficult in Auckland, where the mortgage payments on a lower quartile-priced home had ballooned to $622 a week, taking up 39% of typical first home buyers' take home pay.
Ominously, Auckland was on the verge of becoming unaffordable for first home buyers on average wages.
September 2017 to September 2023
When Jacinda Ardern's Labour-led Government took over the Treasury benches in September 2017 the national lower quartile dwelling price was $350,000 and in Auckland it was $650,160.
Six years later in September 2023 the national lower quartile price was $585,000 (up 67%) and in Auckland it was $799,000 (up 23%).
So the rate of house price growth at the bottom of the market under Labour moderated in Auckland but rapidly played catch up in the rest of the country.
On the income front, the take home pay for typical first home buyers increased by 25% nationally and in Auckland over the same period.
The other element in the affordability mix is mortgage interest rates which have been on a roller coaster ride over the last six years.
The average of the two year fixed rates was 4.70% in September 2017 and it fell to record lows in 2020/21 as a tsunami of cheap money was pumped into the economy to stave off a post-lockdown recession, only for interest rates to rocket back up to try and counter the rising tide of inflation which followed.
In September 2023 the average of the two year fixed rate was 6.92%, the highest it had been since July 2010.
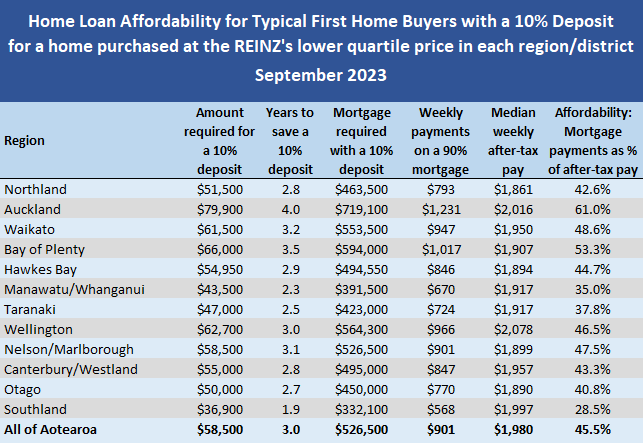
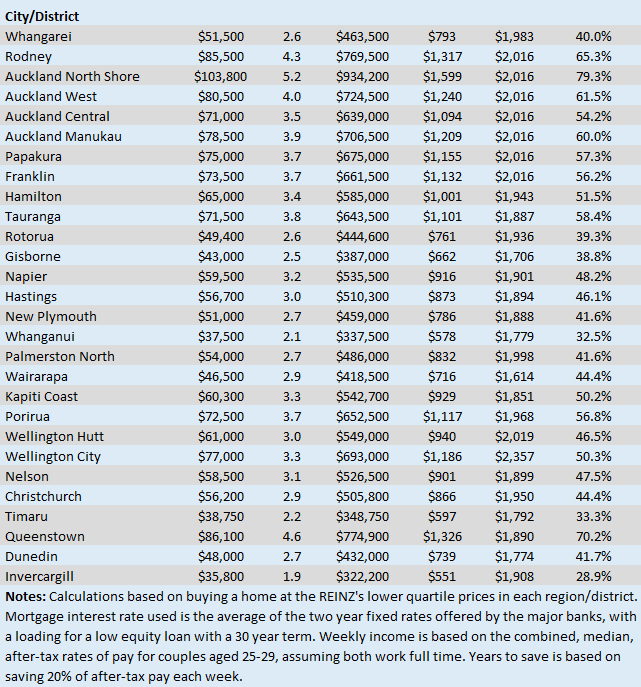
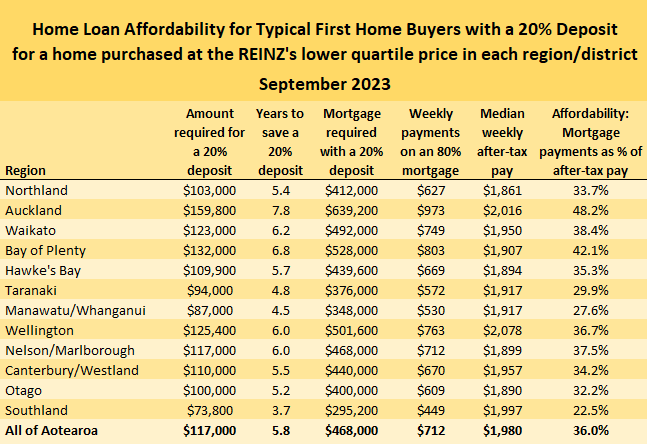
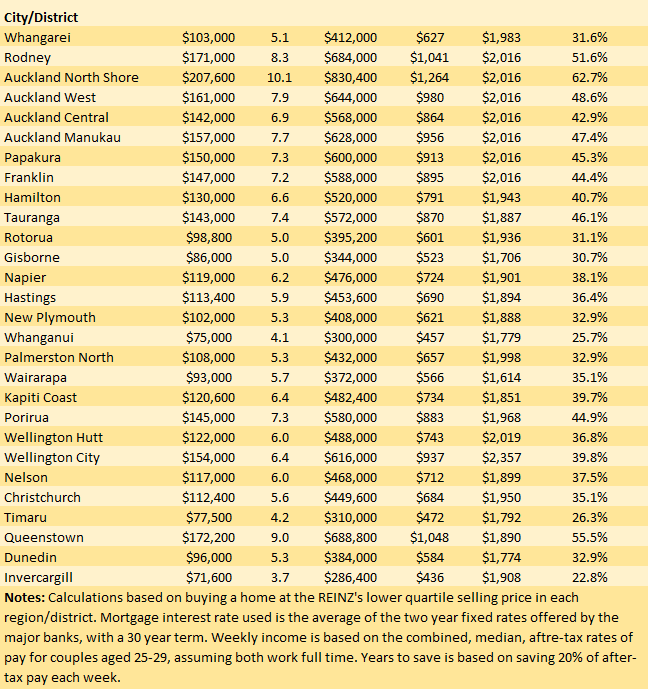
The overall effect of that was that while Auckland housing had been on the verge of entering unaffordable territory in September 2017, it marched well into it over the next six years, with the mortgage payments on a lower quartile-priced home in the region eating up 48% of typical first home buying couple's take home pay (with a 20% deposit), or 61% if they only had a 10% deposit.
Clearly, a home of their own has become increasingly out of reach for aspiring first home buyers on average incomes in Auckland over the last six years.
Not only that, but the surge in prices that occurred outside of Auckland over the last size years means the Bay of Plenty has now joined Auckland in the unaffordable club for first home buyers and Waikato isn't far behind.
So looking at the affordability picture for first home buyers over the last 12 years, it tells a pretty sorry tale whichever political party has been in power.
The tables below show the main affordability measures in all main urban districts throughout the country at the end of September this year, for typical first home buyers with either a 10% or 20% deposit.
The comment stream on this story is now closed.
- You can have articles like this delivered directly to your inbox via our free Property Newsletter. We send it out 3-5 times a week with all of our property-related news, including auction results, interest rate movements and market commentary and analysis. To start receiving them, register here (it's free) and when approved you can select any of our free email newsletters.
We welcome your comments below. If you are not already registered, please register to comment
Remember we welcome robust, respectful and insightful debate. We don't welcome abusive or defamatory comments and will de-register those repeatedly making such comments. Our current comment policy is here.