

Less Asia-based buyers are searching for New Zealand properties on Realestate.co.nz, while more Aucklanders are looking outside of their home region for properties to buy.
The latest figures from Realestate.co.nz show that searches on the property website from potential buyers in Asia were down by 20% in May compared with May last year.
However that was largely offset by an increase in interest from potential buyers in Australia, the UK and USA.
And there has also been a jump in the number of Auckland-based users searching for properties in other regions.
The number of searches of Hawkes Bay properties by Auckland-based users was up 52% in May compared with May last year, with rises in searches by Aucklanders also occurring in Manawatu/Wanganui (+123%), Waikato (+114%), Northland (+86%) and Bay of Plenty (+84%).
"This is a dramatic change in online searching behaviour, which could well be driven by record property prices in Auckland," Realestate.co.nz chief executive Brendon Skipper said.
Those prices are still rising, with the average asking price of Auckland properties listed on the website in May increasing by 0.5% (compared to April) to hit a new record high $793,260.
That helped push the national average asking price to a new record high of $532,638 in May, up 2.1% compared with April.
Average asking prices were up in most regions in May compared to April, with the biggest increases occurring in the lower South Island, led by Central Otago/Lakes +15.7%, followed by Southland +12.5% and West Coast +11.3%.
In Wellington they rose 1.4% and in Canterbury they were up 0.3% (see graphic below for all regions).
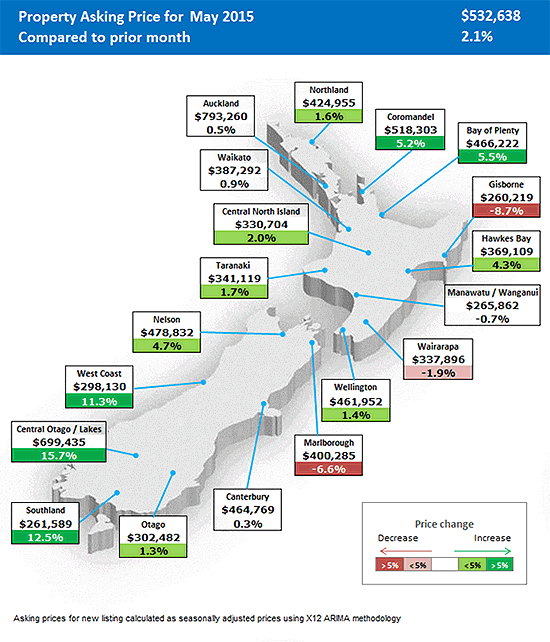
The only regions that posted declines in average asking prices in May were Gisborne -8.7%, Manawatu/Wanganui -0.7%, Wairarapa -1.9% and Marlborough -1.9%.
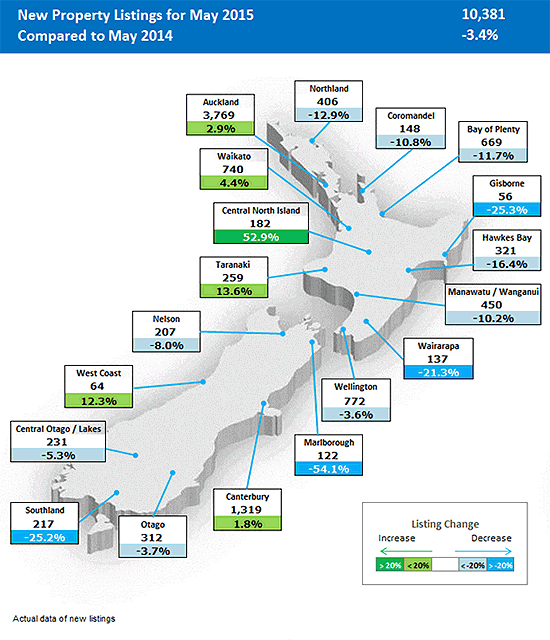
The numbers of homes listed for sale on the website was mixed in May, with new listings up in Auckland, Waikato, Taranaki, Canterbury, the Central North Island and the West Coast , but down in all other regions.
Nationally, the website posted 10,381 new listings in May which was down 3.4% compared with May last year (see the chart below for the regional breakdown).
Housing inventory
Select chart tabs
-------------------------------------------
 Our free Property email newsletter brings you all the stories about residential and commercial property and the forces that move these huge markets. Sign up here.
To subscribe to our Property newsletter, enter your email address here. It's free.
-------------------------------------------
We welcome your comments below. If you are not already registered, please register to comment
Remember we welcome robust, respectful and insightful debate. We don't welcome abusive or defamatory comments and will de-register those repeatedly making such comments. Our current comment policy is here.