

The national median house price edged up by 1.9% to $550,000 in December, but house sales volumes continue to lag, according to the latest Real Estate Institute of New Zealand figures.
In the full year the median house price gained 5.8%, with Auckland house prices moving up just 1.8% to $870,000 - though the median house price for Auckland dropped $10,000 in December compared with November.
But sales figures continued to be soft, with the 5,903 houses sold nationally in December down some 10.1% on the same time a year ago.
The 1,693 houses sold in Auckland in December was the lowest figure for a December since 2010.
'Signs of life'
However, ASB economist Kim Mundy said the housing market had "showed some signs of life in the end of 2017".
"Sales activity lifted over the final months of the year, median days to sell stopped slowly grinding higher and prices firmed again in many regions."
Mundy said the housing market had been "rocked" by a number of changes over the past 18 months and there were more changes on the horizon.
"As a result, we still think it’s too early to say with any certainty that the housing market has turned a corner. Legislative changes in 2018 are likely to adversely impact investor demand which could slow overall activity again in 2018."
Kiwibank senior economist Jeremy Couchman and assistant economist Mike Shirley said they see housing market activity gradually picking up over the coming months, but to remain modest compared to the buoyant market of a few years ago.
"The RBNZ recent loosening of loan-to-value ratio (LVR) restrictions should help support activity at the start of 2018, and supply and demand imbalances in the housing market remain.
"However, there are a number of factors in play that are likely to limit the upside pace of a recovery in the market.
"Net migration has started to ease (although remains elevated), housing affordability constrains haven't gone away, available property listings are growing, and government policy changes may limit the role the investor segment plays."
This is the full media release from REINZ:
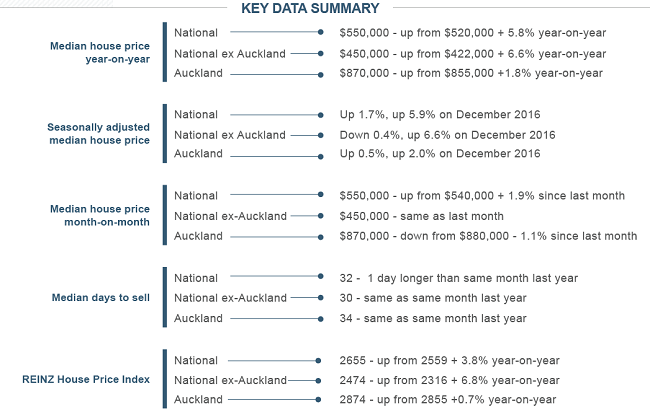
REINZ said Median house prices across New Zealand rose by 5.8% year-on-year to $550,000 – up from $520,000 in December 2016 and median prices for New Zealand excluding Auckland increased by 6.6% to $450,000 (up from $422,000 in December 16) according to the latest data from the Real Estate Institute of New Zealand (REINZ), source of the most complete and accurate real estate data in New Zealand.
Auckland’s median house price increased 1.8% in December to $870,000 up from $855,000 compared to December 2016.
This price growth is consistent with what we have observed with the REINZ HPI.
13 out of 16 regions saw prices increase in December, with three of those regions experiencing record prices:
Waikato – up 11.7% year-on-year to $525,000 (a $35,000 increase since November 17 and a $55,000 increase since December 16)
Bay of Plenty – up 20.4% year-on-year to $598,000 (a $23,000 increase since November 17 and a $101,500 increase since December 16)
Wellington – up 4.7% to $560,000 (a $10,000 increase since November 17 and a $25,000 increase since December 16).
Three regions saw a price decrease year-on-year – Marlborough (down 2.1% to $372,000), West Coast (down 1.6% to $185,000) and Canterbury (down 0.7% to $439,000).
Bindi Norwell, Chief Executive at REINZ says: “Median house prices across New Zealand have increased 5.8% in December, representing an increase of $30,000 since the same time last year. This increase defies the predictions of many commentators who 12 or 13 months ago were adamant that house prices would fall in 2017.
“While the increase will be welcome news to those looking to sell their property, for those first home buyers this will not have been the Christmas present they were hoping for. Although there is some hope as the rate of price increases has decreased significantly compared to previous years meaning that if the trend continues, there is more of a chance that those saving for a house deposit can keep up with increasing property prices,” continues Norwell.
The number of properties sold in December across New Zealand decreased by 10.1% to 5,903 – down from 6,567 in December 2016 and the number of properties sold in New Zealand excluding Auckland decreased by 11.6% to 4,184 (down from 4,733 in December 2016).
Auckland volumes decreased by 6.4% to 1,693 (down from 1,808 in December 2016).
Nelson was the only region to experience an increase year-on-year with 76 sales compared with 71 sales in December 2016.
Regions with the biggest decrease were:
Gisborne – a decrease of 30.6% (43 properties vs 62 in December 2016)
Northland – a decrease of 23.4% (177 properties vs 231 in December 2016)
Southland – a decrease of 21.4% (136 properties vs 173 in December 2016)
West Coast – a decrease of 20.6% (27 properties vs 34 in December 2016).
“December represented a continuation of the theme we have seen throughout 2017, whereby the number of properties sold across New Zealand decreased every month when compared with the same month in 2016. It’s a tough comparison, because 2015 and 2016 were very strong years for the industry, and set quite a high bar, so any comparison was always going to be more moderate beside these outlier years,” says Norwell.
“On a positive note, there were a number of areas that saw an increase in the number of properties sold. For example, the Rangitikei District saw a 90.9% volume increase year-on-year (21 sales up from 11 in December 2016), the Buller District saw a 50% volume increase year-on-year (12 sales up from 8 in December 2016), Auckland’s Franklin District saw a 41.4% volume increase year-on-year (99 sales up from 70 in December 2016) and the Waitaki District saw a 32.4% volume increase year-on-year (45 sales up from 34 in December 2016),” continues Norwell.
“When looking at the seasonally adjusted sales volumes in December when compared to November, the figures are far more positive, showing that sales volumes were actually higher than we would anticipate for this time of year,” she continues.
Days to sell
The median number of days to sell a property nationally increased by 1 day (from 31 to 32) when compared to December 2016.
Regionally, West Coast saw the biggest increase in the number of days to sell (up 26 days to 189), followed by Taranaki (up 9 days to 36), Nelson (up 8 days to 29) and Tasman (up 7 days to 30).
Regions with the biggest decreases year-on-year included Gisborne and Southland (both down 3 days to 28 days) and Hawke’s Bay (down 2 days to 27) the lowest number of days to sell for the month of December in 9 years.
REINZ House Price Index (HPI)
The REINZ House Price Index for New Zealand increased 3.8% year-on-year to 2,655. The HPI for New Zealand excluding Auckland increased 6.8% from December 2016 and Auckland’s HPI increased 0.7% for the same period.
The REINZ HPI also showed that five regions (Waikato, Bay of Plenty, Tasman/Nelson/ Marlborough/West Coast, Otago and Southland) all reached new highs during December indicating strong value growth in these areas.
Regions with the highest growth year-on-year were Gisborne/Hawke’s Bay (up 15.0% to 2,332), Southland (up 13.4% to 2457) and Manawatu/Wanganui (up 11.0% to 2,437).
“As there appears to be less urgency for buyers to purchase a property, as well as for vendors to sell their property, we’ve seen sales count drop and the days to sell increase during 2017. However, as vendors have been holding steadfast to their pricing expectations, we’ve still seen the price of properties going up, which is reflected here in the increased HPI,” points out Norwell.
Auctions
In December, auctions represented 14% of all properties sold in New Zealand, down from 18% in December 2016. This represents 827 properties sold under the hammer, down from 1,154 properties in December 2016.
Of those 827 properties sold by auction, more than half (55% - or 455 properties) were in Auckland, 13% were in Canterbury (105 properties), 8% were in Waikato (68 properties), 4.5% were in Wellington (38 properties) and 4% were from Otago (29 properties). The remainder were spread across the rest of the country.
Inventory
The number of properties available for sale nationally increased by 9.3% (from 22,521 to 24,610) compared to 12 months ago, and for New Zealand excluding Auckland the number of properties available for sale increased by 2.1% (from 15,784 to 16,113).
Regions with the largest increase year-on-year in the number of properties for sale were Auckland (up 26.1%), Wellington (up 21.0%) and Canterbury (up 18.6%).
Regions with the biggest decrease year-on-year in the number of properties available for sale were Taranaki (-17.7%), Hawke’s Bay (-14.9%) and West Coast (-12.2%).
“Even though Wellington saw one of the biggest increases in inventory, there is still only 7 weeks inventory left – the least in the country, which is a pattern the region has been experiencing for some time now. Additionally, the Hawke’s Bay only has 9 weeks’ inventory available, highlighting the popularity of the area,” points out Norwell.
Price Bands
Between December 2016 and December 2017, the number of homes sold fell in every price bracket except for the $2million to $2.99million category which increased by 4.3%. During December, 96 properties were sold for between $2million - $2.99million, up from 92 properties in December 2016.
The number of dwellings sold for less than $500,000 in December 2017 fell by 18% compared to December 2016 from 3,148 to 2,577 representing 43.7% of all homes sold across the country.
“Only 560 properties across the country sold for less than $250,000 – a 29.9% drop from December 2016. This was the lowest number of properties in this bracket on record, showing how price increases are impacting across the regions,” concludes Norwell.
The full regional report is available here
Volumes sold - REINZ
Select chart tabs
75 Comments
The RE industry is like a plane needing a certian level of momentum to stay "flying". If a plane starts to stall it either lowers altitude to regain momentum (air speed), or increases engine speed to acheive the same.
Todays RE industry has the engine speed option all but removed by new/incoming govt policy. Going to a very tough year for all staff working there (eg 2008/9)
What are you talking about? Number of houses for sale, or house prices?
I'm still trying to figure out how the Govt will be able to level off or lower house prices or what policy would force people to put their house on the market at a reduced price.
Cost to build is still going up, cost to develop land is still going up.
That is why a lot of Aucklanders/Wellingtonians are buying in places like Hawkes bay e.g. Napier/Hastings/Waipukurau, because they find solid houses on decent sections selling for less than replacement cost with rental returns of 5% or higher.
Yes, the plane is stalling and will crash and burn spectacularly over the next few months. I am predicting houses in Wanaka dropping to $150k in the next 6 months. You won't be able to give away houses in South Auckland where $50k will buy you any and all on offer. The bubble has burst and the end times are here.
Wow this is great news, ill sell my car and buy two houses!
The regions have been undervalued as well as Labour's inflation producing policies. Steady upward trend. Although some will scoff and say the faster you go the bigger the mess.
Huge hike in building material prices released over the holiday period will keep that trend moving upwards.
Increased costs for new housing, leading to higher prices or reduced floor and land sizes. Increased wages will improve affordability at least for now until interest rates change.
Quote from the report; "there are approximately 30% fewer investors in the market with many looking to sell their portfolio rather than expand it"
Not a report to salivate over when the truth to the increased median lies within the sales price distribution.
Arguably even more important...
"The number of dwellings sold for less than $500,000 in December 2017 fell by 18% compared to December 2016 from 3,148 to 2,577 representing 43.7% of all homes sold across the country."
You can sing all day about how mean and median prices are growing, but if you have that disclaimer in there things are far from peachy.
its amazing how biased reporting can be, none would mention (explain) that
True. Stats are just that, but so is spin. Reinz is required to act like a cheer leader I guess.
I'm surprised they haven't thrown in a "biggest December - January" statistic in there for good measure.
500k investor segment. None of that explains away the lift in the regions
Of course it does.
In the regions, the proportion of properties transacted under $500k would be substantially higher that say AKL or WLG.
Thus, it should actually affect their numbers more...
Nymad, less houses are selling for under $500K as prices are rising. Given rising prices you would expect less sales in under $500K bracket and more in $1 million + bracket. For example a house that 12 months ago would have sold for 485K would now sell for 515K, changing bracket due to change in prevailing price levels rather than composition of properties selling. REINZ index is stratified so adjusts for changes in composition of sales, so is the most accurate index.
A 30% reduction in sales volume that is mostly disappearing from the $500k category is therefore good for property speculators? No.
That will have some impact for sure, not confident it explains the whole of the change though. REINZ index is stating that Auckland house prices have fallen in the last year in real terms (0.7% increase vs inflation just shy of 2%). The rest of the country is chugging along alright at 6.8% over the year. Auckland index graph is looking very flat over the last year and half or so. In Christchurch/Canterbury house prices in terms of median and index appear to be falling slightly even before accounting for inflation.
So, where is the sales deficit coming from then? 18% from bracket creep, alone. Even when you are going to be getting bracket creep from $250k, also?
Or, are you just assuming that the density of those sales comes from properties centered around the population median/population distribution (I'm assuming the distribution is far from normal)?
edit:
Look at page 5 of the report, it debunks you bracket creep perspective with a basic overview of the price distribution.
https://www.reinz.co.nz/Media/Default/Statistic%20Documents/2018/Decemb…
The stratified index may be a loose control for composition change. However, it in no way adjusts for any quality change.
So, no, it is nowhere near the most accurate. The only thing it has going for it is that it is easy to calculate at higher frequencies and loosely approximates the quarterly SPAR index.
It's a shame that price distribution is nationally and not for Auckland.
Just because the data does not meet your expectations, does not mean it is manipulated.
A lower percentage of properties that sold were in the under 500K bracket, and every other bracket made up a higher percentage of sales compared to 12mths previously, because prices are rising. If you went back 20 years over 50% of sales would have been in the under 250K bracket. This is just what happens with rising prices.
You see one thing, I see another.
The age old story.
Nymad, I'm siiinging in the rain... lol
If house prices are increasing every year, obviously there will be less sales in an arbitrary non relative bracket such as <500k. It should be obvious to a blind man. Total number of homes <500k is decreasing, the crash is only in your brain.
Right now the RBNZ moves to allow more 90% LVR are looking kind of desperate. For some banks it's 15% of the mortgage book and they're considering 20%. RBNZ are acting like they're in a huge panic.
If the banks believe there's going to be investors trying to sell off property then they need to ensure that there are sellers to complete the transactions.
@dictator You think that's what desperate looks like...
FWIW: Homes.co.nz emailed me their latest estimated value (1071 > $2m), it equated to a 0.68% increase in the prior month.
Good for you.
Fool you, if you take any notice of it.
It has no relevance other than a data point. The home is mortgage free and hopefully will be passed to my children in the same state and kept in the family. If the market dropped 60% as some have predicted, then I'd double down. I've been saving hard to take that opportunity if it ever comes.
That's commendable.
Many people who hang onto estimates like that are not in the same position, though.
Just remember...
It's not a data point.
It's a function of observed data points.
Said observed data points are based on an observed sample of transaction data.
When sample size decreases, probability of convergence to some normal limiting distribution decreases.
When that happens, variance of said estimates increases.
Result: Out of sample estimates become wildly more inaccurate.
Meaning: High level of risk in claiming you house is worth $xx.
Unless it shows declining prices, in which case it's all good. Ah Nymad.
Not at all what I said or vaguely implied.
I'll give you the dumbed down version. OP was talking about valuations. I said that given decreasing sample size will be hurting the accuracy of that estimate. This is irrespective of the price level.
But hey, take what you will from it.
There's also less sales in the under $100k bracket. Once that part of the market becomes active again we'll see the median stop rising and start to fall!
Like
I expect houses in Remuera to slip back into this category.
If they are lucky! More likely Remuera owners will have to pay you to buy their 300m^2 homes with expansive views of Rangitoto and access to top schools. Those suckers dont even see it coming!
HAHAHAHA!! That is by far the funniest post I have seen this year, given we're only 19days in, but still! 10 out of 10.
The pattern for the end of 2017 could be perfectly described by the phrase "Bull Trap".
Not saying that the small lift *was* a Bull Trap, only the next 6 months will indicate that, nonetheless, it might well transpire to have been.
It is interesting that you mentioned the "Bull Trap" because this has appeared in most historic graphs after a rapid rise in asset values, whether it be housing, tulips or bitcoin etc... Human nature drives bubbles and does the exact reverse once the consensus of the people think that the market has topped out and the same people that drove up the prices then become fearful of buying into a declining market. Sometimes it is referred to as "The Dead Cat Bounce".
I just don't think we should read into it too much. Median price is a beast especially with the increasing of new houses in the market. E.g If you buy a house for 2mil, subdivide and build 3 houses and sell 1.2mil each, you already help increasing the median price. But I think, median price will go down since there is a recent surge in consent for townhouse & Apartment. It would be nice to have average price vs median price.
A bouquet to REINZ whom it is so easy to slag off (often with some justification).
I congratulate REINZ on producing their detailed monthly freebie report. As a homeowner and investor I find market trends essential to what is by far my biggest financial investment and decisions.
Although their press releases may be perceived to may have some bias, I would think that we are all old enough to evaluate reports and comments with critical thought.
Shows you how resilient the housing market actually is doesn’t it!
Prices are pretty stable and bearing in mind all the forces in play over the past year in trying to curtail the growth.
We all know that house prices will continue to grow into the future, end of story.
Auckland and Christchurch City look like they are two exceptions to the current trend where house prices are either stable or are rising. Auckland had a good run and probably got a bit too expensive for many including first home buyers and something had to give. Christchurch City where a lot of new homes have been built and existing homes have been rebuilt but many people have left to get away from the devastation and start a new life. No wonder houses prices are now the 17th highest in New Zealand which is amazing for a city which should in theory be at number 2 or 3.
only if you can actually sell the house.
Its Aucklands worst year for sales volume since 2011 and every month the volume drops on the same month from the previous year.
Its all the junk in the $500K to $850K that isnt moving, which is why the median looks artificially high.
Buyers are now biding their time and the banks just arnt as willing as they were a year or two back.
What we have in this segment is alot of people who want to make a profit on what they have bought during an artificially inflated market fueled by off shore money which has undoubtedly dried up. There are no buyers for the overpriced crappers,
inventories will continue to rise until prices retreat.
medium prices in Auckland dropped from Nov - Dec in spite of this! there is a message in there somewhere...
Quite right.
I am hearing of lots of properties selling for 10-15% less than they would have sold for one year ago.
As you say it's the low volumes in the 500-850k range that are keeping the median up.
Like for like the market is down 10-15% from peak
Any links, any data??
Waiting with bated breath.....
Please add this Herald Article today to the above report ....
http://www.nzherald.co.nz/property/news/article.cfm?c_id=8&objectid=119…
Many think that lower volumes, investors' selling, New policies to scare the horses, and longer selling days are all good for the property market and FHBs and would "eventually"drive prices down !! ... that all sounds great ... but, In time they will realise that all the above will have a reverse action that would disappoint this prevailing yet distorted logic ... Keeping Supply and Demand facts and projections out of future predictions clouds many commentators calculations and views ... ignoring the time lags of adding new stock to the market is another !!
The report above, like many to come in the next few months, only chips off these hopes and will puzzle this distorted view as to how to spin this supernatural phenomena ...!
The fact that we are building LESS than required to accomodate our Organic Growth alone ( not including moving houses, deaths, divorces, and immigration) should be food for thought for all the hopefuls who just like to follow statistical models and basic simple calculations..!!
Bottomline, Dec 2017 was higher than Dec 2016, It will be very funny if March 2018 will end up higher than March 2017 (the peak!) .... that might blow away the Crash theory for a while!
However, July 2018 will be higher than the bottom of the current market July 2017 ... lol, who needs Netflix when we have all these reports to read ?//
I personally wish and hope that this Gov would live to its promises in building new houses alongside the private sector and what is currently being built ATM .... and hope that they will seriously address and increase the Stock Shortage Issue enough to satisfy some of the accumulating & upcoming demand -
Eco Bird, you called the housing market bottom last July on several occasions. What's also notable is your efforts to nuke any messenger that threaten this July 2017 prediction.
It's probably time to shed some colorful feathers of pride and make the most of your evolving ecology. Odds on, it's pretty much altitude loss from here with many tailwinds and large lows forecasted.
When labour markets weaken so can rents. What will be will be ;-)
The stratified index for Auckland was +0.7% Year on Year, which is actually down in real terms.. and certainly given previous trajectory I would have thought that vindicates the theory that prices are starting to be driven down (when coupled with stale and record levels of inventory). Liquidity is very important for any market. But that's just a "statistical model"
Are you saying investors who bought for capital gains (e.g. anyone recent in Auckland, where there are rental losses and on interest only) would be happy with this return? What if it lasts 2,5,10 years (Japan still flat >30yrs later). What then?
It's an easy statement to say not enough is built for 'organic growth' .. what sort of houses are being built? For example, out in Ormiston East Auckland there are thousands of new homes being built that will look like 1 home on paper but they're all 5-7 room mcmansions with granny flats. All $1.5m-$2.5m .. and if the bottom falls out there, the median will be hit.
But also don't forget migration is a 2 way policy.. plenty more people can move out than move in and are born. Not too distant past in fact.
Let's be clear - I am neither baying for a crash nor calling one, I am purely pointing out that analytically there is much more downside risk than upside.
Prices have been falling by 40%, OK they haven't yet, but now they are... almost..., they will fall 40% very soon... wait for it... not yet... definitely soon... or a bit later possibly but they are definitely falling 40%
Prices have been falling by 40%, OK they haven't yet, but now they are... almost..., they will fall 40% very soon... wait for it... not yet... definitely soon... or a bit later possibly but they are definitely falling 40%
Well yes. That sums it up nicely. You have no idea what's going, neither do those who pump out the media releases. Include the sheeple in the critical mass of those who don't know what will happen to house prices. Much better to focus on what you don't know than to cling to what you want to believe.
But what do we actually know?
Bubbles tend to elevate the sheeple's spirits and therefore consumer spending, which is the lifeblood of the economy. If prices were to fall 40%, the economy would likely be toast. But what if they only fell 5% or 10%? What impact would that they have? I don't know and the sheeple would not know. Would a fall in consumer spending mean further falls in house prices? Vicious circle perhaps.
All things to ponder and likely to be more relevant than speculating on house prices, which is no different than playing Blackjack and pretending you know how to beat the house.
Investing in houses is very much like BEING the house at the casino, you may not win all the time but over the long term...
Investing in houses is very much like BEING the house at the casino, you may not win all the time but over the long term...
The analogy is different. I'm talking about the gambler who thinks that they're making the right calls based on method and probability. However, their method and understanding are usually based on fable as opposed to infallibility. They get a pleasure when the cards fall their way, much like on the Blackjack table. It's driven by emotional gratification, not some kind of master program based on myriad permutations and combinations.
Yes, house prices have increased relatively steadily for quite a number of years. HOWEVER, we are now very much in unchartered territory due to rediculous amounts of QE sloshing around and unprecedented world debt . Thus there is absolutely NO guarantee that the past trend will continue. It is anyones guess how the future will enfold but there will be winners and losers in our housing market.
Is that what all the Irish, Japanese, Italians, Californians etc all thought?
BTW plenty of casinos have gone bust. Ask Trump.
Lol, I thought it was more like 50 and 60 % ...:) ...nevermind! .... I will wait, hope it doesn't take decades though !!
Wonderful. All we are doing is bidding up the price of land further & NZ is becoming yet more unproductive. Actual "house" prices will only go up by the construction price index or CPI.
haha, wait few years when you get AI to predict the market for you ...lol, apparently they are getting more intelligent than humans ( and certainly some commentators !!) --- !! that will be real fun as opposed to real estate ..... :)
I am not human, I am AI
"I am 'an' AI"
Time to buy few more houses using your bitcoins!
A chartist might suggest another run at $9,200.
A fundamentalist might suggest “worthless”.
Where is TTP?
I guess he just keeping a low profile :)
So here, in currently rain soaked Auckland, what would be considered a return to some level of normalcy?
For me, a relatively easy benchmark is the traditional 2 bedroom brick and tile, the sausage flat or the granny flat.
Franchi and Ion built thousands of them in the 60,s and 70’s – (I googled that because I remember them as a kid – the Franchi’s lived a couple of houses up from us in far simpler times).
In an average suburb, in average surroundings, what should they be worth, or valued at.
In my mind, a return to normalcy would suggest $300 - $350,000 for a comfy little place to retire into – relatively maintenance free with a glorious Hills Clothesline within easy reach.
That to me would be a suitable correction – and not a crash.
Top 15 Suburbs - QV Median Home Value Jan 2018:
1 Herne Bay $2,568,050.00
2 St Marys Bay $2,253,400.00
3 Remuera $2,091,600.00
4 Stanley Point $2,043,800.00
5 Campbells Bay $1,973,800.00
6 Orakei $1,918,900.00
7 Westmere $1,902,200.00
8 Epsom $1,901,950.00
9 Mission Bay $1,878,250.00
10 Ponsonby $1,785,250.00
11 St Heliers $1,783,050.00
12 Kohimarama $1,762,700.00
13 Takapuna $1,758,450.00
14 Devonport $1,728,850.00
15 Glendowie $1,714,350.00
That median price list is a strong message for all non-property-owning professionals - doctors lawyers scientists and engineers ought to leave Auckland. Either go to the provinces or leave the country. The wealth transfer is working against you if you choose to stay in Auckland.
My God – thank you for posting, and while we're at it, thank you QE, absurdly low interest rates and of course a special mention to a former currency trader’s completely mindless folly.
What on earth has happened to my city/ country of birth?
I see absolutely nothing to celebrate or cheer for here at all.
We have merrily sold ourselves out to the highest bidder - no matter what their credentials or background.
Quite disgusting, simply an embarrassment to this country, and a total disgrace.
Interesting to note these figures for Auckland for last 12 months
Franklin district up $60,000
Manukau up $40,000
North Shore up $76,000
Papakura up $85,000
Rodney up $9,000
Waitakere up $24,000
Auckland City down by $62,000 .
If you were offered a service, or a report of sorts, that with a reasonable degree of accuracy predicted movements in price with a 3 month +/- accuracy; How much would you be willing to pay for this? And, what would you (in short) do with that information?
Take your point bigblue - it appears that possible corruption and money laundering may have thus been more prevalent in the now former "finer" suburbs listed by Double-GZ than those you have submitted.
However, as always I live in hope, perhaps there's not that much truth to all the stories of various new buyers that abound - surely we're not all that gullible.
This North & South Article is required reading, if you haven't read it already, regarding the level of corruption / money laundering in New Zealand.
We welcome your comments below. If you are not already registered, please register to comment
Remember we welcome robust, respectful and insightful debate. We don't welcome abusive or defamatory comments and will de-register those repeatedly making such comments. Our current comment policy is here.