
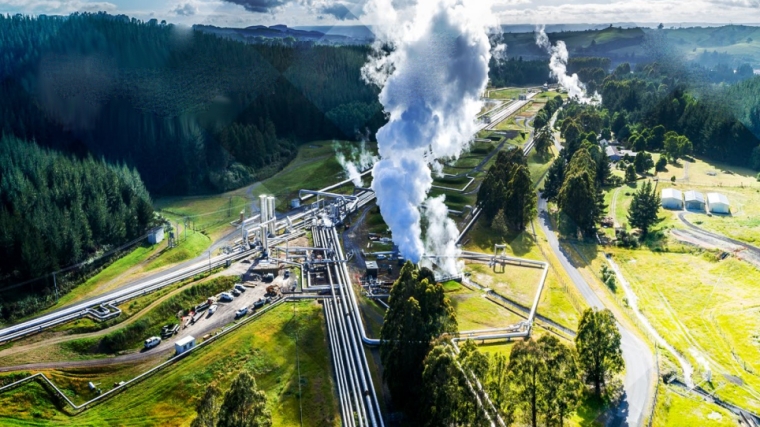
The recently released “New-Zealand’s-Greenhouse Gas Inventory 1990-2019” makes concerning reading about the trends of New Zealand’s emissions.
It confirms what most have known that despite what has been put in place for now and the future it is going to take mammoth steps to come close to meeting our Paris commitments (5% less than 1990 levels) let alone what the government is aspiring for (50% less of 1990 levels by 2050)
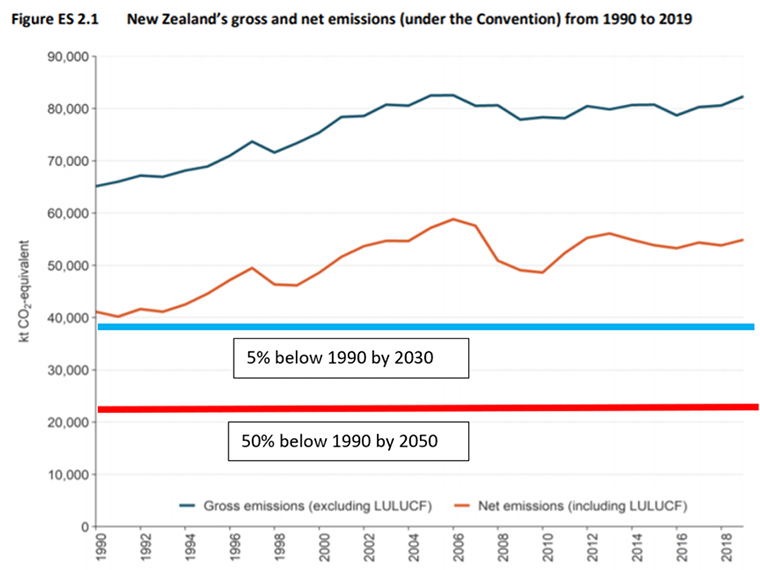
As can be seen in the above graph while net emissions have flattened somewhat in recent years, they need to emulate the period in the 2008-2010 period from now on to get close to where ‘we’ need to be.
Most readers are aware that most of the emissions to date have come from agriculture and transport and the report highlights this. Unfortunately, what the report doesn’t overly focus on is trends, rather it looks at 1990 and at 2019 and reports the distance. This does not show what some of the changes that are happening within agriculture and transport (energy). However, the report does include the following graph.
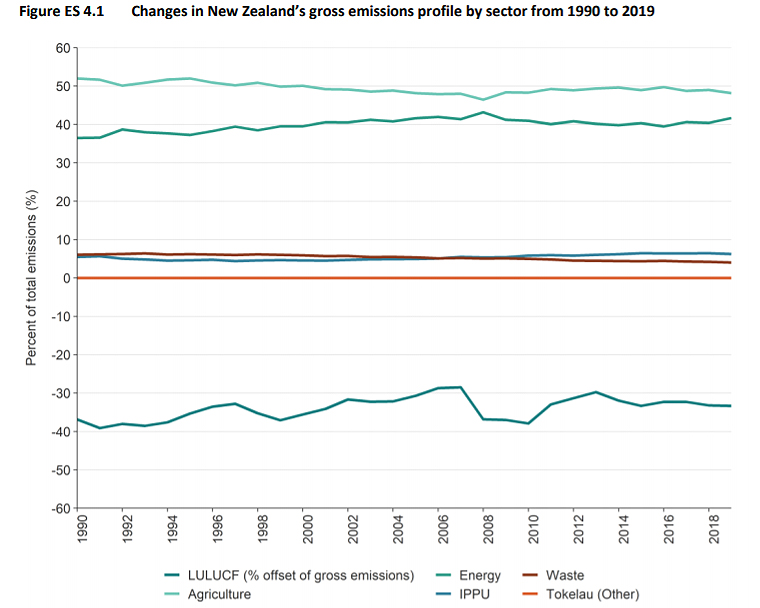
It confirms the view that despite all the noise around agricultural emissions the rises have been coming largely from transport (all of us) and in large doses. Not that agriculture, particularly the large-scale conversion to dairy over this period and the felling of plantation forestry to help facilitate this, have not made a huge contribution over this period.
However, while dairy cow numbers have increased by 82% of 1990 numbers, they are now back at 2011 levels and providing dairy farmers can resist the temptation to ‘buy’ additional production with brought on feeds (Westpac’s forecast of $8.00 per kg MS will certainly make this a real ‘risk’) the trend will continue with more land coming out of dairy production than seemingly going into it.
Sheep are well below 1990 levels (58m 1990 to27m 2020) as are deer. Beef cattle numbers are bucking the trend a little with lifts over the last 5 years (3.5m to 3.9m approx.). However, still well below the 4.6m herd size in 1990. This has meant that agricultural emissions are now at 2005 levels. So, falling, but admittedly no where near the rate they and others need to fall but still, going in the right direction.
Sticking with agriculture since 1990 CH4 (methane) has increased by 5.9% however the other major agricultural GHG, N20 has gone up by 46.9%.
The big discrepancy between the two is that there has been a substitution effect between sheep and dairy cows regarding CH4 as per volume of feed digested similar amounts of CH4 get emitted, the big gains have come from the additional feed being grown on farms converted to dairy from sheep (and trees) and fed to cows. N2O emissions however, should be less from sheep than cows. (Sheep have proportionately smaller bladders and ‘tinkle’ small amounts more often which plants are able to more readily absorb prior to converting to N2O).
Cows tend to ‘flood’ when they urinate putting effectively the equivalent of 1000kgs N per ha on the area flooded. The plant is unable to come close to utilising this and therefore the opportunity is far greater for the urine to convert to N2O (and does). On top of this (and the report focuses upon this) there has been a 663% increase in the use of Urea (nitrogen) since 1990 the report writers surmise this is where the N2O has come from.
I don’t totally disagree, however, I suspect a lot of the gain is due to the extra feed produced by the additional urea is passing through cows and ‘flooding’. Much the same end result but slightly different route.
Dairy farmers now have limits on how much N (urea) can be applied and also N being allowed to convert to N2O is effectively wasted if not being utilised by plants so applying large amounts is economically counterproductive not to mention the environmental denigration.
Needless to add the big gains in country's emissions are coming from transport. The 2020 figures show a reduction due to the lockdown period and lack of international tourists but it is going to be a blip rather than a trend. Overall total New Zealand emissions were down -4.8% with transport estimated to be down -38% - before heading back on the previous track.
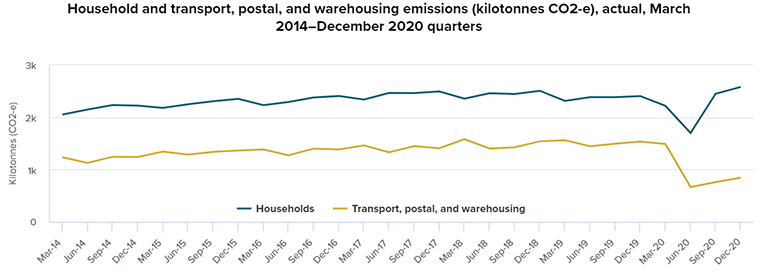
Recent reports have shown that transport emissions are continued set to increase with Auckland set to have a +6.1% increase as population and motorways increase transport usage.
How New Zealand gets out of the cleft stick it has with transport is difficult to see without central government taking a major role. Rural folk due to being well away from public transport, may be affected more than urban people by potential future changes.
All switching to EV’s may be a solution in the cities but having followed a Nissan Leaf (EV) briefly over the Rimutaka Hills the other day it is going to take considerable additional expense for farmers and others to get vehicles that are able to emulate what SUV’s etc can currently do. What I do believe though is that while the agricultural ‘problem’ is more around economics than politics, the transport issue is more the reverse (accept nothing is ever quite that black and white).
Until a government provides real leadership and this will require all Kiwis accepting that some personal sacrifice will be required (more tax to fund more rail etc, higher fuel costs, requirements to get rid of combustion engines etc. etc.) nothing is really going to change.
At the moment transport emissions are able to hide behind the agricultural screen, but that is changing, be it slowly.
We welcome your comments below. If you are not already registered, please register to comment
Remember we welcome robust, respectful and insightful debate. We don't welcome abusive or defamatory comments and will de-register those repeatedly making such comments. Our current comment policy is here.