

Given that we are in the pits pf winter it seems somewhat premature to the thinking about what summer may bring us in five or six months. However, given the steady media diet of heat waves and wildfires coming out of the Northern Hemisphere plus floods from across in Australia, the weather patterns are hard to ignore.
Just because Europe and others are experiencing record temperatures does not necessarily mean that we are in for the same here. Last year for many kiwis the weather was dominated by rainfall rather than extreme heat or drought, Southland being the exception.
So, what are the experts predicting for this coming summer?
Firstly, a lot can change in forecasts between now and then, however they seem to agree and with ‘high degrees’ of confidence on one thing, it is going to be warmer than average.
Actually, despite last summer not being a memorable one for sunshine it was still the 5th warmest on record and with a high of 34.7oC (Lake Karapiro).
The UK, not usually noted for its weather, has already hit 38.1oC (its record is 38.7oC set in 2003 so quite away ahead of New Zealand - oops as of today 40.2oC).
Largely the New Zealand temperatures are driven by our surrounding ocean, and we are still in the midst of a marine heatwave with water temperatures between 0.7oC and 1.9oC above average and our land temperatures are bound to increase. This in turn is driven by the La Niña oscillation phase we are still in. NIWA are predicting quite a high likelihood of this persisting into its third summer, not unheard of but relatively unusual.
This does not guarantee that the up coming season will be the same as the last but we can be assured it is going to be warm, the question is; just how warm?
The NIWA graphics below do look rather dramatic with the whole country in deep red. However, it is the July to September period and no temperatures estimates are attached.
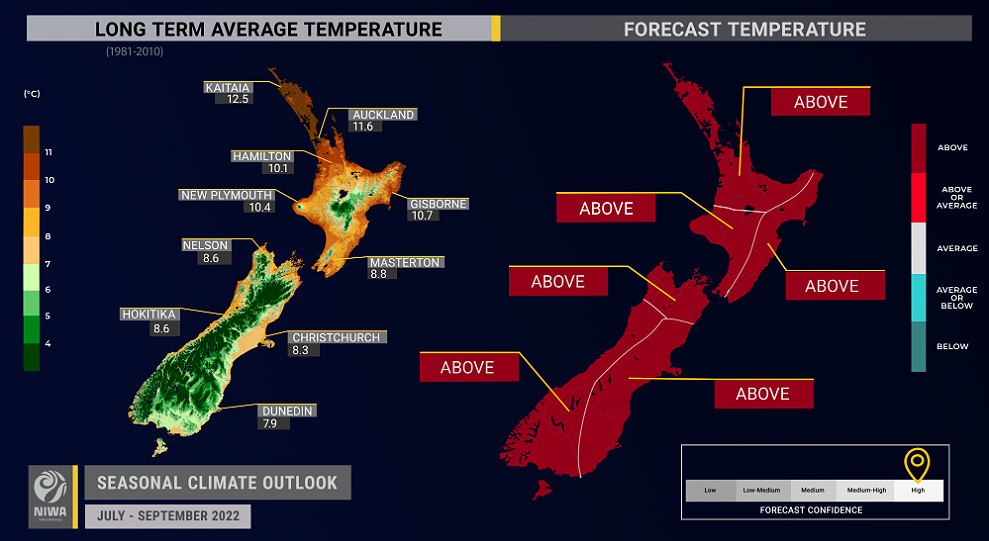
Source: NIWA July 2022
For farmers, anything away from what is considered normal (or average) can be an issue for stress although most pastoral farmers don’t mind a bit more rainfall than average over the summer, its just not great for the arable and horticulture sectors.
If the season tracks more like what we are seeing in the north hemisphere, then there is reason to be concerned. Heatwaves interrupted by heavy deluges are good for no one and animals in particular can suffer.
Ironically in the Canterbury and other widely irrigated areas, farmers are required to meet ‘best practise’ guidelines when they sign up to irrigation schemes and the like. Unfortunately, ‘best practise’ in regards to irrigation revolves around limiting excess water runoff and wasteful drainage thereby reducing the flow of N and P into waterways and aquifers.
To get the control required to meet best practise has generally meant that there has been the widespread removal of trees on and around pasture land as the large centre pivot and long lateral irrigators are the best set up for the finer controls provide by computer programmes and savings in labour. Rotor-rainers and the similar smaller irrigators have, through the drive to greater efficiencies, gone into the annals of history. Along with them many shelter belts and shade giving trees.
If the temperatures through the summer go as predicted then increasingly animal welfare is going to become an issue and farmers will yet again be on the receiving end of societies ire. Yet another reason that some form of barn or shelter are incorporated into livestock systems.
Frustratingly, given that world emissions are still on the increase and when countries such as the US has courts which ruled against the science and reduces the ability of the Federal Government to curb emissions, you know that for a large part of the world’s population we are going to have to learn to life with the effects of climate change for our ‘natural’. Hopefully, children born now will see some improvement in their lifetimes.
When it comes to mitigating against the impacts of climate, a piece on the national news which covered the story of Canterbury coastal farmers facing being inundated by the ocean and the lack of support from the regional council may be a sign of things to come. Local bodies and central government alike are going to have to pick their battles carefully in the future especially when it comes to coastal inundation given the cost and potential scale of the problem around New Zealand.
On the brighter side at least the level of lakes used to provide hydro electricity are at good levels. National hydro storage stayed constant at 90% of the historical average for this time of year (July 13th, 2022). North Island hydro storage decreased by 7% to 155% of the historical average. South Island storage remains at 83% of the historical average for this time of year (after the last 48 hours they are likely to exceed this now). So, the country should be in good stead to run both irrigators and air conditioners if the need requires. Currently it also means that the ‘spot price’ for power has also reduced.
24 Comments
Sea temperature anomalies around NZ have been declining and are now pretty much back to normal.
Here is the data from NOAA as at 18 July.
Global temperatures for June were also rather cool relative to recent years.
Here is the UAH satellite data.
It will be interesting to see what July looks like, given the very specific heatwaves in some very specific locations. despite the heatwaves, my expectation is that July will also be somewhat cool globally, given the current La Nina pattern, or at least not particularly high, but we will have to wait and see, with July data probably available about 3 August.
The current pattern of sub tropical lows making their way across NZ is clearly linked to the La Nina pattern we are in. But not all La Ninas are the same. It is not often we see a year like this one!
KeithW
Why quote UAH temperature data? It's the least reliable and least relevant dataset. Surface temperature, where humans and animals live, is the logical dataset to use as a reference.
The advantages of the UAH data set include comprehensive coverage of both land and ocean, with an internally consistent dataset going back to 1979, and availability in close to real time, and transparency as to methodology and adjustments. No other data set meets all of these criteria.
KeithW
and it matches very well with sea surface and radiosonde data.
https://woodfortrees.org/plot/uah6/from:1979/to/plot/uah6/from:1979/to/…
Both the UAH and RSS satellite datasets are down 0.7 degrees since early 2016.
https://images.remss.com/msu/graphics/TLT_v40/time_series/RSS_TS_channe…
? The anomaly for may 2022 is 0.5336 and in 2016 was 0.7284
How are you getting 0.7 degrees below 2016?
That woodfor trees graph seems to show we've gone up 0.6 of a degree since 1980...
RSS and UAH peaked in Feb 2016.
RSS 1.2612-0.5336 = 0.7276.
UAH 0.7 - 0.06 = 0.64
Trend 0.13 degrees of boring inter glacial warming in the satellite record. Strikingly similar warming rate to the first half of the 20th century when industrialisation was a small fraction of what it is now.
Good thing we have a senior scientist from RSS publicly stating satellite measurements are not the gold standard you claim they are. People might be misinformed.
https://www.youtube.com/watch?v=8BnkI5vqr_0&ab_channel=greenmanbucket
Ok I see. (Not sure comparing one month's anomaly in one year with another one in another year is particularly useful but i get your point. We could pick another month(s) and show that the incraese was much greater...e.g. feb 2012 = 0.0199. So 0.682 (april 2022) - 0.0199 =0.483 in a decade! ).
Of course 2016 was a strong el nino year and we'd should expect there to be slightly warmer and colder years but the overall trend is still up. I'd be willing to bet that the next time we get a strong el nino year it will top 2016.
https://www.climate.gov/news-features/understanding-climate/climate-change-global-temperature
As for the industrialisation bit remember that the oceans also soak up a lot of heat and that will be ameliorating some the of the air temp rises.
Seeing as warming is greatest over land and at the Earth's surface, where air is densest, having a dataset that measures temperature from 0-12000 metres isn't going to tell you how severe surface warming is.
The UAH dataset doesn't measure temperature at the Earth's surface. It measures a slice of atmosphere, from zero to 12km. It is not a surface dataset. Because heating is greatest at the surface, it is never going to be as relevant as a surface dataset. The same is true of claims by climate science denier "profile" below. Radiosonde data matches satellite data because it also measures a slice of atmosphere, not surface temperature! Why bother quoting UAH when surface datasets are readily available? http://www.columbia.edu/~jeh1/mailings/2022/MayTemperatureUpdate.17June2022.pdf
Keith, according to that map temps look mostly 1 degree above "average"?
You can zoom in a bit more on this one for a bit more detail
That is a great tool. I zoomed out and it seems pretty balanced across the planet in terms of above/below average.
Yep i love exploring on it (you have to click on the "earth" label bottom left, which you sometimes have to scroll up to see). There's heaps of data to look at, co2, so2, particluates, temps fires etc. Fascinating.
If you zoom out of my previous link you can clearly see La Nina in the blue swath across the pacific.
She's here to stay till next year now by the sounds of it so it'll be a mild winter
These experts reckon back to back hottest years are on the cards for NZ.
https://i.stuff.co.nz/environment/climate-news/300641834/new-zealand-on…
I think I'll go with what the experts have to say (rather than someone who seems to downplay the severity of AGW whenever he can - nothing to do with his links to the livestock industry I would imagine).
I recall a relatives beautifully balanced Southland farm I once new well. Lamb, beef, wool, venison, velvet all produced. Planted waterways, shelter belts, flax groves for the fawns to shelter in. Land and stock all lovingly cared for. Clear waterways suppling the stock. Homestead with beautiful big garden ornamental and food for the home
Some years back I took the bus through southland looking out for the farm as I passed.
What I saw was unrecognisable. Land with every tree removed, a farm house isolated in the middle of a paddock, barren landscape and pivot irrigation in it's place.
I steel feel sick from that sight. Southland was once a fine part of the country, well farmed with family ownership.
Now a dairy infected mess.
I haven't seen any analysis on what a couple of days of 40 degrees with strong winds will do to crops in the UK at this time of year... and it was mostly the eastern side where there's lots of arable farming that got blow torched
I can't remember what happened to arable crops back in 2011, here in South Canterbury, when we had a 40+Deg C day. As it was early Feb, much was already harvested. I remember the street trees in Timaru having their leaves burned off on the west side, and the apples in my home orchard cooking on the tree.
The summer of 2020, strong hot winds in January made oodles of grass from a very wet December disappear in a month. It was pretty shocking.
All the above pretty complicated. Well , if you can't dazzle them with brillance....
I recommend watching Weatherwatch.co.nz daily , to get an idea of the local (South Pacific , Australia and NZ ) weather patterns. Plus their and Metservices monthly preductions.
From that i see you can predict weather , based on the battle between highs moving through from the west , with lows forming in the north (warm wet weather), and lows coming from south of NZ ( cold wet weather ).
The last few summers have been dominated by huge highs , sometimes stretching right across Australia, moving West , to cover the Tasman Sea , and NZ . Unless there is a gap between these highs to let a low descend South , no rain for long periods. This has happened for the last 3 summers ofr the upper north Island , and East of the South Island.
We have had a fair few frosts earlier in winter, but right now these rain events coming from the north or west have set the pasture alight. Probably our warmest winter for a good couple of years. 2020 and 21 were pretty chilly.
We had one day in June that went to -1, so that goes into the met service records as around average . Every other day was 2 to 3 degrees above average lows. So far in july , we have had 1 day at 1.4 degrees , every other day was at least 4 degrees above average lows, many days wasy above. the day after the 1.4, the low was 13 degrees ! . Truly bizarre , and quite frankly scary. Yes , i know there is a dfiference between weather and climate. And average and mean temps, but still. Our average lowest temp for July is minus 2.
Keep in mind NIWA are in the CC alarmist camp or not far off it so will present their data in a way that confirms man made CC.
Fire gutted houses along the Thames. Hottest day in UK. Floods in South Island.
Not quite close to an extinction event.
I'm guessing you're the sort of guy that doesn't believe in road signs?
We welcome your comments below. If you are not already registered, please register to comment
Remember we welcome robust, respectful and insightful debate. We don't welcome abusive or defamatory comments and will de-register those repeatedly making such comments. Our current comment policy is here.