
One of the outputs of the Productivity Commission's report (published earlier this month) was that agriculture needed to adopt newer technologies.
The principle behind this is should be twofold; the first is that outputs per person employed would increase and secondly less people would need to be employed. On top of this is the potential for New Zealand to export some of these technologies which while not a component of agricultural exports is using our natural competitive advantages in the primary industries to be leveraged into other areas.
The report and latterly David Skilling in a recent conversation with RNZ has said that New Zealand is continuing to fall behind other small advanced economies (SAE) and there is a need for New Zealand to ‘create’ more large export companies similar to Fonterra, Zespri and perhaps Xero.
Along with the headline that New Zealand has been falling behind other OECD countries in its productivity, the primary sector while being recognised as performing better than other sectors of New Zealand, is also lagging. I took this as read, although being part of the agricultural sector for a large portion of my life always felt New Zealand, at least in the primary sector appeared to be doing pretty well, at least relative to our competitors. So, I decided to have a deeper look to see what evidence I could find to support either view, i.e. whether New Zealand’s primary sectors are over time performing better or worse than other comparable countries.
Given New Zealand being at “the end of the bus route” there are obstacles of distance and freight costs in gaining the competitive advantage required to support large companies on shore. However, primary sector industries can compete despite this major disadvantage by being able to produce high quality products so cheaply (relative to competitors) and at scale it gets around this issue.
Bearing all this in mind I thought a look at New Zealand’ agriculture's progress at both productivity and contribution to the economy could be useful. To do this I looked at total persons employed in agriculture over time and as a percentage of the total employed population and then looked at agriculture outputs to see what changes had occurred largely between the years 2,000 and 2020. Perhaps crude measures but so be it and I compared New Zealand to two other SAE’s in this case Denmark and the Netherlands which are two smaller countries with a high degree of intensive agriculture and therefore presumably higher adoption rates of technologies and the USA, mainly because there is plenty of information available and a source of much of modern technology.
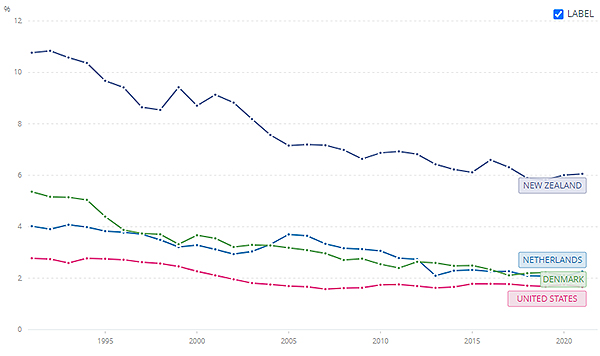
New Zealand’s primary sectors workforce as a percentage of the total population not surprisingly at 6% is two to three time higher than the comparable countries given our lack of competing industries. In this case the data on the graph below goes back to 1991-2021.
Employment in Agriculture
(% of total employment)
Source: ILO
What the graph shows is that both Denmark and the Netherlands have dropped by 60%, which is close to the “High Income” countries average New Zealand has (only) dropped by 45%.
The USA is the outlier with the least drop of 33% - perhaps due to the low starting point going from 3% to 2%. Looking at real numbers (rather than percentages) the trend remains similar. In actual numbers (rather than a percentage) since 2000 New Zealand’s number of persons employed in agriculture has remained pretty static at 97% (168,014 down to 162,790) with Netherlands and Denmark each having similar drops to 73% and 64% respectively. The USA again more like New Zealand at 95% of the 2000 levels.
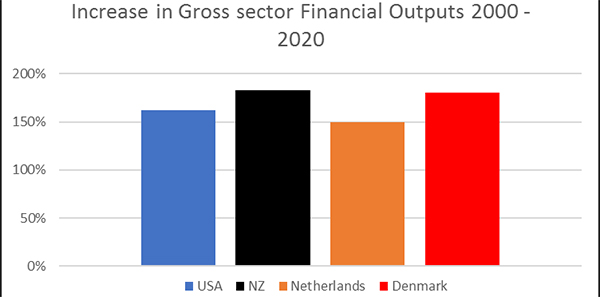
Looking at what increases of financial outputs have occurred over the same period, New Zealand compares very well with an 83% increase in financial outputs
Source: Created from multiple sources.
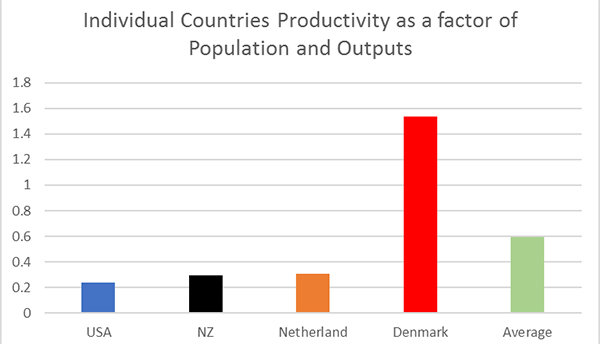
Unfortunately, when the outputs are measured against the size of the workforce then New Zealand’s advantage does start to slip. Denmark having the greatest reduction in its primary sector workforce and having an increase in output of 80% stands out as having the greatest degree of productivity (by this measure). I might add that the financial returns are relative to the countries own economies and not converted to, say, US dollars.
Source: Created from multiple sources
This is not to say that New Zealand primary sectors have anything to apologise for. However, these measures do show that based on a per head basis (not hours worked) there is obviously some room for potential improvement. Denmark which has a population (5.8 mln) similar to New Zealand’s has a food and fibre output over double that of New Zealand’s and given that Denmark (only) has 2.65 mln/Ha of productive land versus New Zealand’s 13.9 mln/Ha be it much of it with far lower productive potential it does make you wonder at what New Zealand’s potential could be especially as New Zealand also has a far larger maritime economic zone as well.
So, perhaps the Productivity Commission is correct in its assumptions and could have been tougher on the primary sector if it wasn’t for the fact that it is still largely the most productive of the major groups.
The fact that New Zealand has the highest percentage of its workforce of the four countries still employed in agriculture probably is the major indicator that New Zealand has room to ‘tech-up’ where these advances could come from is not for today, although the Productivity Commission leads the discussion with the adoption of gene technology.
We welcome your comments below. If you are not already registered, please register to comment
Remember we welcome robust, respectful and insightful debate. We don't welcome abusive or defamatory comments and will de-register those repeatedly making such comments. Our current comment policy is here.