
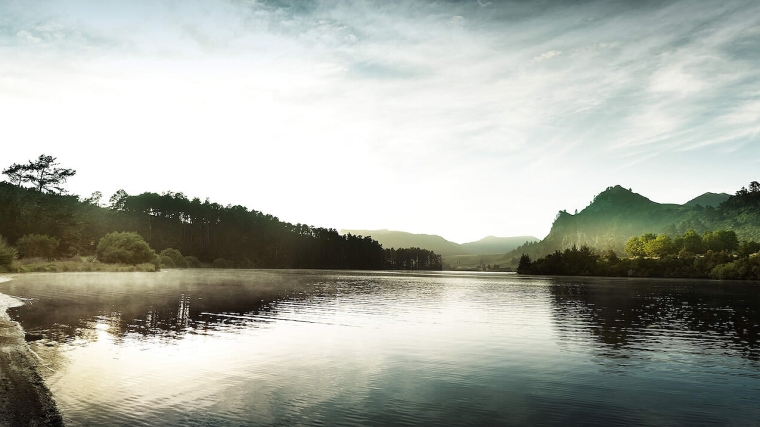
In the lowlands of North Waikato, where the river stretches wide and begins its final journey to the sea Stu Muir farms the same land his family has worked for six generations. His farm sits at the heart of a landscape that tells the story of New Zealand itself - a place shaped by water, by time and by the people who have lived alongside both. “The Waikato River runs right through the back of the farm, where it opens up into a delta region,” Stu says. “It’s a beautiful part of the country. We’ve got the bush, the harbour, the ocean and the river.”
The Muir farm, once sheep and beef and now a thriving 500-cow dairy operation reflects a balance between production and protection. Stu’s life, however, has never been defined solely by farming. A history graduate who spent years travelling through India, Asia and Africa, he came home to take over the family property not out of obligation, but from a deep recognition of place. “Somebody had to come back,” he says with a smile.
Today, Stu’s leadership extends well beyond the farm gate. As a Crown appointee and Deputy Crown Chair of the Waikato River Authority, he helps oversee one of the country’s most ambitious environmental restoration efforts - an 80-year, intergenerational project born out of the Waikato River Treaty settlement. “The Authority gets about six million dollars a year, which it distributes to projects ranging from under ten thousand to around a million,” he explains. “It could be a small whanau group or a big iwi-led restoration. The key is improving the health and wellbeing of the river. We’re thinking long-term, the fertiliser put on 80 years ago is still making its way down to us now. So we’re taking the same timeframe to put it right.”
For Stu, change often begins with individuals who are willing to act even when it’s unpopular. “When I first started it wasn’t looked upon that favourably,” he recalls. “People thought what the hell is he doing? But once they saw the results - the birds coming back, the possums and rats gone, the trees regenerating - they started to understand.” What began as one farmer’s experiment has become part of a wider local movement. “Now we’ve got multiple landcare groups here, including one my cousin’s just set up that’s really taken off. There’s a lot happening you just have to dig a bit to find it.”
Stu’s passion for grassroots involvement extends to the next generation. He sees children as critical to the long-term success of environmental projects. “If you get the kids involved, they don’t have those old prejudices or ideas. You change them and they’ll change the world,” he says. “That’s where real, fundamental, long-term change happens.” From school pest-trapping groups to Trees for Survival plantings and even prison nursery programmes, he believes every hand that plants a tree or sets a trap builds lasting ownership of the land. “If people can see a positive outcome from their actions, they’re more inclined to stay on that path.”
On his own property, the transformation has been profound. “We’ve planted tens of thousands of trees,” he says. “Anything marginal went back into native bush. We opened up waterways and whitebait spawning ponds. Every paddock’s been reshaped and recontoured. We’ve built a big wintering barn that’s completely revolutionised the way we farm. We’re saving nutrients, protecting soil and still running a profitable business.”
It’s this balance, production and protection working side by side that Stu believes represents the future of New Zealand farming. “Some people assume that being beneficial to the environment and farming are diametrically opposed. They’re not,” he says. “When you focus on your most productive land, you get more profit and when you give back the parts that aren’t, you build biodiversity and resilience. It’s good business and good stewardship.”
He’s equally clear about the need for collaboration. “We don’t always have to agree on why we’re doing something,” he says. “What matters is that the job gets done. You’ve got to have buy-in from all walks of life, mana whenua, farmers, government, community. That’s where the strength lies.” In his view, too much energy is wasted arguing with those who refuse to change. “You’re better off backing the ones who do want to make a difference and helping them succeed. When the rest of the community shifts, the outliers either join or get left behind.”
Stu believes real progress comes from combining knowledge systems, western science and mātauranga Māori, each grounded in generations of observation. “We both have a scientific methodology,” he says. “They come from different viewpoints, but together they give us a clearer picture. I’ve got very little time for people who won’t listen to the science.”
Despite the challenges, shifting regulations, political swings and funding constraints Stu remains optimistic. “You see a lot of pride among farmers now,” he says. “Most want to do the right thing. We just need consistency. It’s frustrating when policy keeps changing, but the movement is too far along to stop. The reality is our customers overseas care about how food is produced. If we want to stay at the top, we’ve got to stay ahead.”
For Stu, the river is both a responsibility and a legacy. His children, surfers, hunters and environmental scientists alike, have grown up watching the land and water heal. “They’ve seen the difference,” he says. “They get it.” And in that simple truth that next generation connection lies the future of the Waikato itself: a river still flowing, and a community still learning to live by its rhythm.
Have a listen to the podcast to hear the full story.
Angus Kebbell is a producer at The Weekly Hotwire. You can contact him here.
1 Comments
Stu is trying hard and good on him but the data in general is damning. An ai summary follows-
Historical Data Table: Waikato River Pollutant and DO Trends (Summary: 1993–2022)
Indicator/Pollutant% of Sites Deteriorating% of Sites Improving% Unchanged or Uncertain Main Notes
Dissolved Oxygen (DO)71%13%16%DO trend mostly deteriorating across catchment
Nitrogen (Total)67%17%17%Increasing, mainly upper catchment
Phosphorus (Total)40%40%20%Mixed direction
E. coli50%19%31%Many deteriorating sites; main driver is upper catchment
Ammoniacal Nitrogen52%13%35%More often deteriorating in lower catchment
Arsenic0%100%0%Improving at all mainstem sites
Chlorophyll a (phyto)0%70%30%Improving, especially downstream
Water Clarity36%52%12%Improving at over half of sites
Note:
-
Trends above are for mainstem and major tributaries, 2010–2019, but consistent with data from 1990s–2020s.
-
“Uncertain” means changes were within the statistical margin of error and not conclusively up or down.
-
Older data (1970s–1990s) indicates a marked reduction in major sewage and industrial pollutants by the late 1980s, then plateauing.
Key Points by Pollutant
-
Dissolved Oxygen (DO): Almost three-quarters of monitored sites show deteriorating DO trends since 2010, reflecting higher biological oxygen demand from nutrient runoff and organic pollution.
-
Nitrogen: Total nitrogen loads have increased over 1–2% per year at most sites, especially upper catchment, driven by fertilizer use and intensified agriculture.
-
Phosphorus: Shows both improving and deteriorating sites—a result of legacy fertilizer, land management, and some improvements in wastewater management.
-
E. coli: Bacterial contamination shows notable deterioration at half the monitored sites, particularly after rainfall, due to runoff from farmland and failing septic systems.
-
Ammonia, Chlorophyll a, Arsenic: Marked improvement in arsenic and ammonia at some sites, with reduced industrial discharge; reductions in chlorophyll also suggest less severe algal blooms downstream.
Interpreting the Last 50 Years
-
1950s–1970s: Widely acknowledged as the peak of pollution, primarily raw sewage, industrial effluent, and minimal controls.
-
1980s–Present: Wastewater and contaminant loads dramatically reduced; more recently, diffuse pollution from agriculture has led to increasing nutrients and biological pollutants, while legacy industrial toxins have generally decreased or stabilized.
-
Current State: Overall, improvement in heavy metals and clarity, but nutrients and microbial contamination are problematic and have worsened at many sites since 2000.
References
-
Comprehensive summary tables and graphical heatmaps covering all the pollutants above are available in the NIWA/WA River Authority report and the Waikato Regional Council data resources.
The water quality data and a strong sense of social responsibility is why people like Stu are taking the actions that he is.
The key question is how to get more landowners into this space where many of the actions can not be driven by regulation, especially relationships with Iwi, the space is currently too confrontational between stakeholders to enable progress at the pace required.
Stu is a shining example of what can be achieved in the dairy farming/ environmental space and the equally important space of Iwi reconnecting with the land.
For many of us dairy farmers who are also working hard to improve the environment in their catchments the greatest challenge is the vocal minority who refuse to accept that the negative can be turned positive, and prefer the hard regulation approach alienating those who are required to do the mahi.
We welcome your comments below. If you are not already registered, please register to comment
Remember we welcome robust, respectful and insightful debate. We don't welcome abusive or defamatory comments and will de-register those repeatedly making such comments. Our current comment policy is here.