
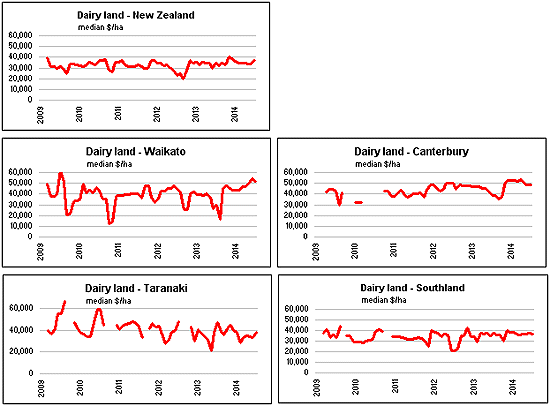
(Updated with dairy land $/ha graphs for selected provinces.)
Farm sale prices took a hit in July, according to the REINZ All Farm Price Index.
The Index adjusts for differences in farm size, location and type, compared with other measures such as median price per hectare, which make no such allowances.
For sales over the three months to July, the Index was 3212.9, compared with 3405.7 for sales in the three months to June.
However the Index was still up 8.8% for the three months to July compared to the same period last year.
The REINZ Dairy Farm Price Index declined by 1.2% for the three months to July, compared to the three months to June, but was up 8.7% compared to the same period last year.
"While annual statistics confirm a solid increase in volumes and prices over the past 12 months, three monthly figures to the end of July indicate an easing in both volumes and prices," REINZ rural spokesman Brian Peacocke said.
|
Three months to July 2014 |
Three months to June 2014 |
Three months to July 2013 |
|
| Arable | 47 | 33 | 20 |
| Dairy | 47 | 69 | 47 |
| Finishing | 105 | 115 | 109 |
| Forestry | 8 | 12 | 11 |
| Grazing | 225 | 236 | 193 |
| Horticulture | 56 | 57 | 39 |
| Special | 24 | 22 | 19 |
| All Farm Types | 512 | 544 | 438 |
Farm sales
Select chart tabs
July sales
The market recorded 132 farm sales in the month of July, which is 9% more than the same month last year and 60% above the average July over the past four years.
The median price per hectare rose to $26,680 in July 2014, and was 29% higher than July 2013.
Higher average prices applied across the board, except for forestry units. The six dairy farm sales during July was the lowest monthly number of sales since just two dairy farms were sold in September 2012.
July sales included:
22 arable farms,
6 dairy farms,
23 finishing units,
61 grazing properties,
12 horticultural,
8 farms of other types
The number of sales is presented here, without the average price, because average prices bounce around dramatically depending on the size and type of business unit being sold. However, the following table sets out the median prices per hectare over the past three months, as reported by REINZ.
| $/ha - July 2014 | Arable | Dairy | Finishing | Forestry | Grazing | Hort | Special | |
| New Zealand | 53,000 | 36,673 | 27,907 | 4,130 | 15,500 | 134,640 | 49,249 | |
| Northland | 15,824 | 17,000 | 9,820 | 86,925 | 36,902 | |||
| Auckland | 133,453 | 24,398 | 52,500 | 7,376 | 17,536 | 220,229 | 92,547 | |
| Waikato | 251,152 | 51,570 | 50,847 | 17,416 | 262,500 | 69,402 | ||
| Bay of Plenty | 19,101 | 43,237 | 33,636 | 17,787 | 195,000 | 13,519 | ||
| Gisborne | 99,585 | 8,840 | 26,875 | 95,646 | ||||
| Hawkes Bay | 11,786 | 5,320 | 109,375 | |||||
| Taranaki | 38,108 | 30,998 | 233,083 | 177,496 | ||||
| Manawatu/Wanganui | 48,009 | 33,543 | 27,027 | 7,813 | 15,570 | 82,500 | ||
| Wellington | 21,095 | 27,957 | 19,077 | |||||
| Nelson | 15,022 | 14,691 | 34,864 | 2,720 | 7,475 | 87,922 | 45,221 | |
| West Coast | 23,514 | 9,949 | ||||||
| Canterbury | 45,250 | 48,455 | 36,250 | 3,959 | 19,591 | 49,231 | 38,093 | |
| Otago | 16,103 | 36,806 | 19,772 | 14,031 | 189,200 | |||
| Southland | 32,366 | 36,673 | 26,491 | 21,000 | 83,893 |
We welcome your comments below. If you are not already registered, please register to comment
Remember we welcome robust, respectful and insightful debate. We don't welcome abusive or defamatory comments and will de-register those repeatedly making such comments. Our current comment policy is here.