
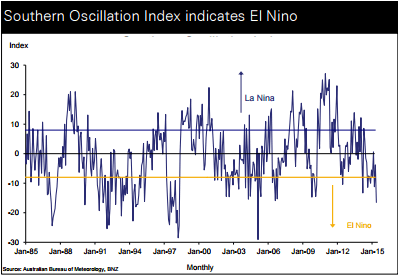
We have been watching the El Nino weather risk from as far back as April last year when the Southern Oscillation Index (SOI) swung lower.
The SOI has been flirting on and off with El Nino thresholds ever since, but has moved decidedly lower over recent weeks (to less than -15 through May more than double the level usually indicative of El Nino conditions). The SOI is only one indicator. Some weather agencies have called El Nino already, others not yet but have high odds on it occurring before long.
All El Ninos are different.
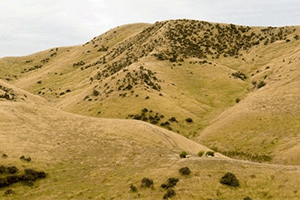
In general during an El Nino New Zealand tends to experience stronger or more frequent winds from the west and south-west leading to dry conditions in the east and more rain in the west. The drought declaration that remains on the South Island’s East Coast is testament to the El Nino-like indicators that have persisted for much of the past year.
In this note, we take a quick look at how NZ agriculture as a whole has fared during various phases of the weather including El Ninos, La Ninas and neutral conditions.
We should say up front that it is difficult to accurately assess the impact of weather on agriculture performance and the economy as a whole. Poor quality data is the first hurdle. And there are many aspects to consider across outputs, stocking rates, inputs and cost changes. Then there are the (biological) lags involved meaning that many weather events have multi season implications, each with their own financing and opportunity cost depending on all other factors at the time. And even when you assess what has actually happened, what do you compare it to in order to judge the weather event in isolation? Tricky. But we take a look.
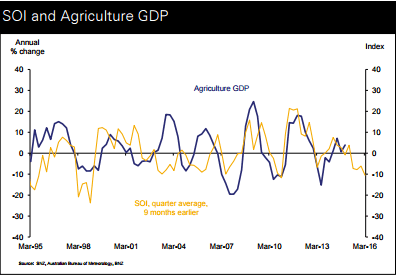
El Nino conditions, and associated low SOI, tend to be negative for NZ agriculture. Recent average levels of the SOI indicate the clear risk that agriculture GDP will decline over coming quarters. We say risk because there is not always a one-for-one relationship, but a decline seems more likely than not.
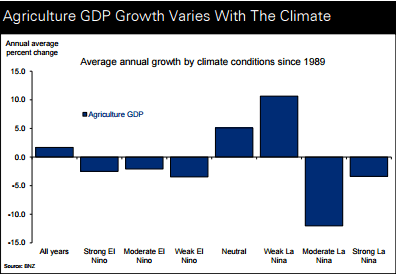
Another way of gauging this is by looking at what the average change in agriculture GDP has been for the season during the various phases of the southern oscillation in the past. We admit looking at one year’s change is rather crude because agriculture performance can swing wildly from season-to-season for a host of different reasons. But, as simple as this analysis is, it does suggest some interesting general results, namely:
• El Nino events (whether weak, moderate, or strong) have previously coincided with modest declines in NZ’s agriculture GDP
• Moderate-to-strong La Nina events have also coincided with declines in agriculture GDP and larger than those associated with El Nino events
• Agriculture GDP has tended to grow faster during periods of weak La Nina events or neutral conditions
We are reluctant to draw very strong conclusions from this given that (even over the 25 year+ time span we looked at) the sample size of each weather pattern is small. But it does suggest NZ agriculture performs best when the weather is not extreme, it intuitively feels right.
Looking at similar metrics for individual sectors increases the chance that season-to-season variation is driven by other factors beyond the current climatic conditions.
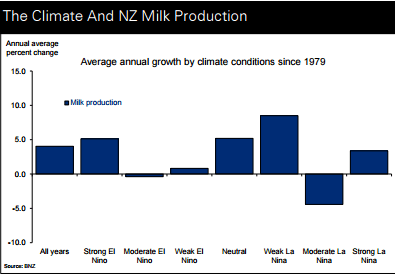
We say this with reference to the stronger-than-average milk production growth coinciding with strong El Nino conditions in the past. This is counter-intuitive. Looking into the detail, the average result is influenced by a 10% lift in the 1987/88 season (a strong El Nino year). This overstates the strength in that season because the +10% did not even make up for the 14% production decline in the season prior (a moderate El Nino year). This highlights that we should not read too much into the specific results here, rather focus on the generalities.
Milk production growth has averaged 1.4% in El Nino years compared to overall average growth of 4.0% since the late 1970s. So, in general, El Nino conditions have tended to restrict NZ milk production growth rather than turn it seriously negative.
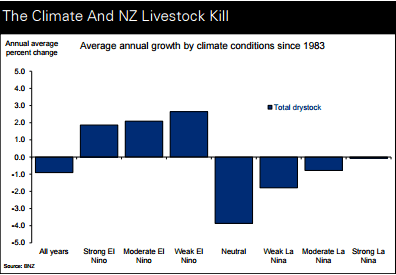
Change in livestock kill numbers correspond to the various states of the climate. Data over the past 30+ years show that livestock kill numbers have tended to increase in El Nino years. This likely reflects an undesirable situation, as farmers run lower stocking rates when dry conditions put pressure on feed supply.
In contrast, when neutral conditions exist, livestock slaughter numbers tend to fall by more than average. This is likely a positive sign as farmers retain to build or rebuild stock units as feed conditions allow. Weak La Nina conditions have also coincided with lower-than-average kill number changes.
Assessing the impact of climatic conditions on prices is even more difficult than on production. There are so many other factors to consider from market demand, to competitor supply, inventory levels, exchange rates, and expectations of all the above to name a few.
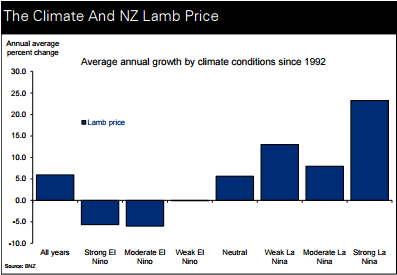
That said, it is interesting to observe that in previous El Nino years lamb prices have tended to decline. In contrast, in La Nina years lamb prices have tended to rise by more-than-average. This relationship could reflect the influence of the climate on the likes of Australian lamb supply or other factors as much as NZ conditions.
The latter is a reminder that El Nino conditions can affect agricultural producers around the world in many different ways. The impact of El Nino on NZ agriculture has tended to be negative in the past. The brewing El Nino risk is well worth monitoring to see how this one pans out.
-------------------------------
Doug Steel is a senior economist at BNZ Research. You can contact him here. This item was first publsihed as a Research Note by BNZ and is here with permission.
We welcome your comments below. If you are not already registered, please register to comment
Remember we welcome robust, respectful and insightful debate. We don't welcome abusive or defamatory comments and will de-register those repeatedly making such comments. Our current comment policy is here.