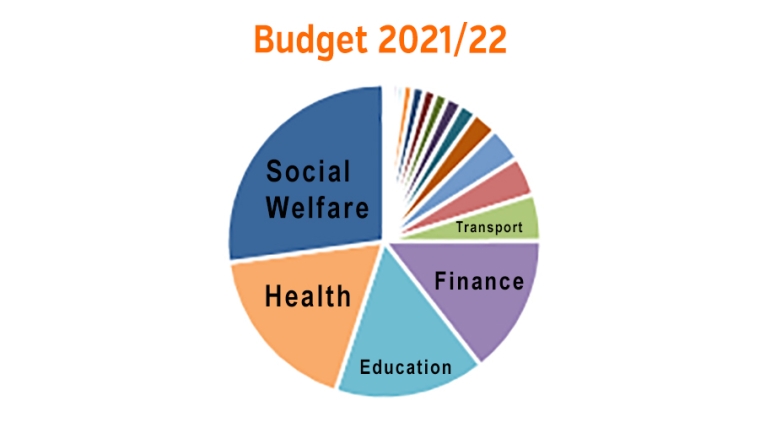
This table outlines the New Zealand Government's planned spending for the 2021/22 budget year.
Actual spending for the previous four years is on the left.
The numbers are drawn together from data released by the Minister of Finance on May 20, 2021.
Links to the primary sources used, from Treasury's website, can be found at the bottom of the page.
Click on any heading to drill down to what makes up these numbers. (Coming soon) Figures for each allocation are in millions of NZ$.
| Actual 2016/17 |
Actual 2017/18 |
Actual 2018/19 |
Actual 2019/20 |
Estimate 2020/21 |
Budget 2021/22 |
% | |
| NZ$m | NZ$m | NZ$m | NZ$m | NZ$m | NZ$m | ||
| 592.2 | 707 | 780.2 | 814.6 | 0.0 | Official Development Assistance (old) | 0.0 | 0.0% |
| 0.0 | 2,257.1 | 722.0 | 0.0 | 0.0 | Social Housing (Old) | 0.0 | 0.0% |
| 0.0 | 2.2 | 16.1 | 17.7 | 17.3 | Pike River Re-entry | 1.0 | 0.0% |
| 3.4 | 3.3 | 3.6 | 3.7 | 3.7 | Parliamentary Commissioner for the Environment | 3.9 | 0.0% |
| 4.7 | 5.2 | 5.8 | 6.4 | 10.1 | Women | 9.8 | 0.0% |
| 9.5 | 10.9 | 10.4 | 9.8 | 14.2 | Serious Fraud | 14.2 | 0.0% |
| 21.8 | 20.5 | 20.1 | 20.5 | 20.8 | Parliamentary Counsel | 23.1 | 0.0% |
| 22.9 | 22.0 | 21.8 | 21.2 | 24.4 | Office of the Clerk | 24.2 | 0.0% |
| 28.4 | 32.0 | 29.8 | 32.9 | 36.5 | Education Review Office | 36.0 | 0.0% |
| 15.0 | 17.3 | 18.2 | 23.5 | 30.5 | Ombudsmen | 49.3 | 0.0% |
| 9.3 | 9.6 | 11.8 | 20.0 | 52.6 | Pacific Peoples | 51.5 | 0.0% |
| 44.0 | 61.7 | 60.6 | 60.9 | 65.7 | Public Service | 62.1 | 0.0% |
| 66.8 | 68.5 | 68.8 | 73.3 | 81.9 | Attorney-General | 93.9 | 0.1% |
| 57.1 | 66.8 | 74.2 | 90.0 | 96.4 | Security Intelligence | 107.8 | 0.1% |
| 90.9 | 94.7 | 94.5 | 101.4 | 113.7 | Audit | 115.1 | 0.1% |
| 110.4 | 90.2 | 107.4 | 128.6 | 139.8 | Prime Minister and Cabinet | 155.3 | 0.1% |
| 89.2 | 89.2 | 89.3 | 97.5 | 212.9 | Sport and Recreation | 162.9 | 0.1% |
| 0.0 | 0.0 | 134.8 | 161.4 | 231.3 | Forestry | 172.2 | 0.1% |
| 150.0 | 152.1 | 150.0 | 167.1 | 235.9 | Parliamentary Service | 186.7 | 0.1% |
| 114.0 | 103.1 | 129.7 | 137.0 | 175.8 | Communications, Security and Intelligence | 212.7 | 0.1% |
| 156.3 | 202.3 | 160.0 | 158.2 | 222.1 | Statistics | 240.3 | 0.2% |
| 197.5 | 214.1 | 229.4 | 246.2 | 298.6 | Customs | 286.0 | 0.2% |
| 176.1 | 305.0 | 99.7 | 62.8 | 557.9 | Te Arawhiti | 427.8 | 0.3% |
| 292.3 | 251.6 | 293.7 | 310.7 | 426.7 | Lands | 469.4 | 0.3% |
| 301.7 | 286 | 330.6 | 385.6 | 605.6 | Arts, Culture and Heritage | 522.5 | 0.4% |
| 291.8 | 306.9 | 336.1 | 432.5 | 524.7 | Māori Development | 542.2 | 0.4% |
| 525.1 | 504.5 | 509.3 | 591.2 | 731.9 | Justice | 622.7 | 0.4% |
| 440 | 441.1 | 488.5 | 555.6 | 717.2 | Conservation | 799.8 | 0.5% |
| 690.8 | 710.4 | 744.3 | 791.3 | 870.2 | Courts | 886.3 | 0.6% |
| 719.3 | 939.4 | 965.9 | 913.4 | 1,155.6 | Ag, Biosecurity, Fisheries and Food Safety | 962.6 | 0.7% |
| 625.0 | 687.8 | 686 | 758.3 | 1,192.5 | Internal Affairs | 1,051.8 | 0.7% |
| 316.8 | 360.4 | 285.4 | 112.6 | 921.4 | Building and Construction | 1,090.0 | 0.7% |
| 156.6 | 863.8 | 980 | 1,132.7 | 1,373.8 | Oranga Tamariki | 1,468.3 | 1.0% |
| 456.3 | 448.8 | 518.4 | 524.9 | 1,474.1 | Foreign Affairs | 1,524.9 | 1.0% |
| 442.8 | 876.8 | 707.9 | 853.3 | 1,180.8 | Environment | 1,736.9 | 1.2% |
| 1,679.9 | 1,757.3 | 2,089.6 | 2,201.7 | 2,291.1 | Police | 2,189.4 | 1.5% |
| 1,601.7 | 1,741.3 | 2,176.9 | 2,106.8 | 2,393.3 | Corrections | 2,278.6 | 1.6% |
| 1,704.3 | 1,874.4 | 2,000.7 | 2,086.8 | 2,518.1 | Labour | 2,662.9 | 1.8% |
| 1,934.3 | 2,252.5 | 2,620.8 | 3,342.0 | 5,721.9 | Business, Science and Innovation | 3,748.4 | 2.6% |
| 0 | 0 | 1,136.5 | 1,683.6 | 2,844.6 | Housing and Urban Development | 4,693.7 | 3.2% |
| 3,310.4 | 3,394.8 | 4,000.5 | 6,910.0 | 4,687.6 | Defence Force | 5,187.1 | 3.5% |
| 3,667.9 | 5,017.0 | 4,767.8 | 5,522.8 | 8,222.4 | Transport | 7,905.7 | 5.4% |
| 5,307.7 | 5,127.8 | 5,596.5 | 6,634.0 | 11,220.9 | Finance | 8,598.1 | 5.9% |
| 5,663.7 | 5,706.7 | 6,721.0 | 11,879.2 | 15,131.9 | Revenue | 15,597.7 | 10.6% |
| 13,604.5 | 14,210.1 | 15,433.3 | 17,505.4 | 17,545.5 | Education | 19,470.2 | 13.3% |
| 17696.0 | 15,666.7 | 16780.0 | 18,584.3 | 22,175.2 | Health | 23,330.9 | 16.6% |
| 24,861.5 | 22,831.4 | 25,769.3 | 40,865.3 | 34,435.7 | Social Welfare | 36,064.2 | 24.6% |
| --------- | -------- | -------- | -------- | -------- | ----------------------------- | --------- | ----- |
| $88,221 | $90,760 | $98,947 | $129,105 | $142,968 | Total Expenditure | $145,804 | 100% |
| $274,612 | $292,897 | $303,287 | $310,261 | $316,552 | GDP (nominal, per RBNZ) | $334,399 | |
| 30.5% | 29.5% | 32.9% | 41.9% | 45.5% | Govt spending as % of GDP | 43.9% | |
| and this compares with taxes collected as follows: | |||||||
| $ 88,559 | $ 92,629 | $ 99,597 | $ 98,766 | $ 107,723 | Total Revenues | $ 108,891 | |
The data in this table is net spending, after fee and charges revenues have been deducted from the gross expenditute planned.
Sources: You can download the data behind these tables from the NZ Government website here.
6 Comments
Interesting so many departments are under-spending, is there a reason they might be so hesitant to put allocated funds to work?
I would isolate Transport and Housing as being particularly disappointing, both in current spending and growth rate, given how urgently the country needs progress on both.
that used to happen a lot in the old days then it was mad dash in the last month to spend as much of the budget as you could so you would not lose it the next year
Classic case I've seen is when everyone got 2 monitors (before it was de jour) for exactly that reason
Haven't seen a lot of talk about the Budget responsibility rules that Labour seems to be ignoring.
https://croakingcassandra.com/2021/05/24/a-questionable-budget/
That leap in Government spending as % of GDP is terrifying.
Are we spending more on debt than we do education?
We welcome your comments below. If you are not already registered, please register to comment
Remember we welcome robust, respectful and insightful debate. We don't welcome abusive or defamatory comments and will de-register those repeatedly making such comments. Our current comment policy is here.