

Bank balance sheets are complicated things. But depositors rely on them to ensure their money will not only be serviced (with some meagre interest), but more importantly the funds can be accessed and returned if necessary.
The Reserve Bank is making an effort to make bank balance sheets more accessible and comparable with their Dashboard tool.
But that tool is also quite dense and too intricate for most bank customers.
We want to take a simplified look at what that data shows, from a bank depositor point of view - whether you just have a current accout, or have savings parked there.
What follows isn't full technical analysis - it however should help you with an initial assessment of how your bank can repay you the funds you have with them.
But first, a bit of technical stuff you should understand. When you move money to a bank, they aren't holding it for you in cash. Your funds in the bank are no longer there - all you have is a claim on the bank for them. You are a creditor of the bank, unsecured at that. This isn't quite as scary as it may sound, almost all bank creditors are unsecured and all rank equally and ahead of the shareholders.
Banks keep very little cash on hand these days to back up depositor claims on them like yours. As you will be well aware, society have moved well away from banknote currency being important. Its all electronic these days. In fact, only a few people can actually remember when banknotes were important. (It seems like it is the informal and underground economy are the only sectors left using them. In fact, the Reserve Bank has been wondering whether banknotes still have a place in our financial system.)
This is how much cash (Notes, Coin, and other cash-equivalent accounts) each of the main banks have on hand to cover your deposit. It's not much.
| Cash equivalents backing for deposits | |||||
| ANZ | ASB | BNZ | Kiwibank | Westpac | |
| Mar 2018 | 3.7% | 3.8% | 6.4% | 4.3% | 5.7% |
| Jun 2018 | 4.4% | 3.3% | 6.2% | 3.6% | 4.9% |
| Sep 2018 | 3.9% | 3.6% | 4.1% | 3.0% | 3.5% |
| Dec 2018 | 4.4% | 3.2% | 4.9% | 4.1% | 4.6% |
| Mar 2019 | 4.3% | 2.7% | 4.1% | 3.6% | 5.7% |
| Jun 2019 | 3.8% | 2.4% | 6.0% | 2.7% | 3.8% |
| Sep 2019 | 3.9% | 2.3% | 6.0% | 4.2% | 4.4% |
And even through it is tiny, it is actually still decreasing.
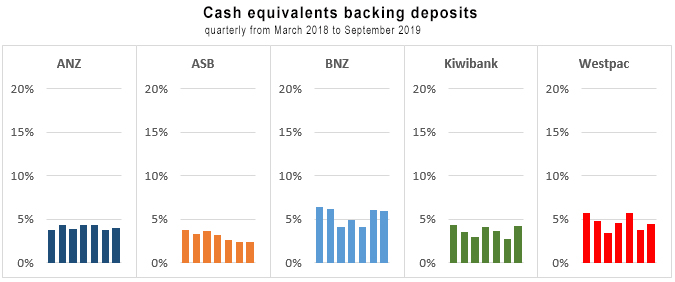
If we ever have a bank run, there would be little point lining up at the teller windows.
Bank deposits make up the vast proportion of how a bank is funded. You might otherwise think that shareholders supply capital to fund bank operations, but that is hardly significant either. Banks are highly leveraged organisations and to extract very high returns, shareholders don't like to invest much capital. This is in fact why the Reserve Bank is cracking down on them, requiring more and better quality capital from bank shareholders. Still, even after these reforms, the levels will be low - although higher than they are now. The following indicates why the Reserve Bank has been uncomfortable with bank shareholder investment levels.
| Shareholder backing for deposits | |||||
| ANZ | ASB | BNZ | Kiwibank | Westpac | |
| Mar 2018 | 12.8% | 12.9% | 11.6% | 9.0% | 11.8% |
| Jun 2018 | 13.1% | 13.1% | 11.6% | 9.2% | 12.1% |
| Sep 2018 | 12.6% | 13.0% | 12.0% | 9.2% | 11.7% |
| Dec 2018 | 12.6% | 13.3% | 11.5% | 8.8% | 11.9% |
| Mar 2019 | 12.6% | 13.1% | 12.1% | 8.7% | 11.4% |
| Jun 2019 | 13.0% | 12.4% | 12.2% | 8.5% | 11.6% |
| Sep 2019 | 13.2% | 12.1% | 12.3% | 8.3% | 11.5% |
While that is more than the cash backing, it is also surprisingly meagre.
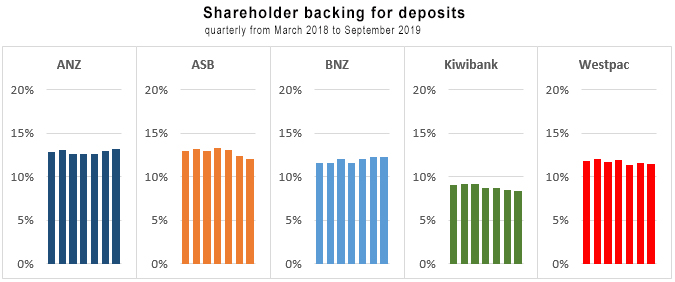
And of course, your deposit is the source of funds banks use to make loans. (And that is somewhat circular - the borrower will then deposit the loan funds in a bank until they need the money, creating more deposits on which more loans can be made. Individually, the effect is tiny and short, but all together, this is the basis of 'credit creation', and the basis of much misinformation and conspritorial confusion over the process. Here is an excellent primer on how it actually works.)
Bankers lend. Those loans are funded primarily from customer deposits, but also wholesale borrowing supplies about 30% of bank funding. So you need to know how much each bank has in loans to cover your deposit. It varies by bank. And the systems works so that depositors supply the capital for loans while the shareholders take the profits.
| Loans to deposits ratio | |||||
| ANZ | ASB | BNZ | Kiwibank | Westpac | |
| Mar 2018 | 121.8% | 138.7% | 130.9% | 112.8% | 128.3% |
| Jun 2018 | 122.0% | 138.5% | 133.7% | 113.6% | 127.7% |
| Sep 2018 | 121.5% | 136.3% | 135.7% | 114.7% | 129.7% |
| Dec 2018 | 119.7% | 137.3% | 132.7% | 111.3% | 128.9% |
| Mar 2019 | 121.0% | 140.3% | 135.7% | 112.7% | 127.7% |
| Jun 2019 | 121.3% | 139.6% | 137.3% | 112.5% | 126.6% |
| Sep 2019 | 121.3% | 137.8% | 135.9% | 111.3% | 130.4% |
There are Reserve Bank limits on how much wholesale funding (Core Funding ratio, Covered Bond limits, etc.) is allowed. This has the effect of keeping demand for local depositor funding higher than it would otherwise be, and deposit interest rates higher than they would otherwise be.
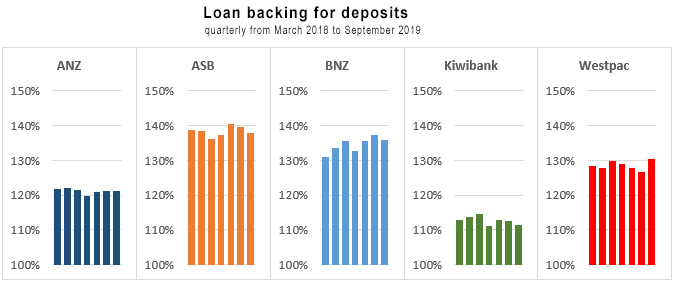
Sunlight is supposed to be healthy. Knowing how your bank uses your deposit, and what they have backing it up should be one factor you can consider when choosing what bank to park your hard-earned funds at.
And finally, you might have a view about how concentrated bank lending is toward residential housing. In fact, most main banks aren't real banks, they operate now more like mortgage banks, the exception being BNZ which has the most balanced lending profile. But if you think like a banker, you may be comforted by high exposure to the housing market, a sector that can be more liquid than business or rural lending. Or excessive concentration may concern you.
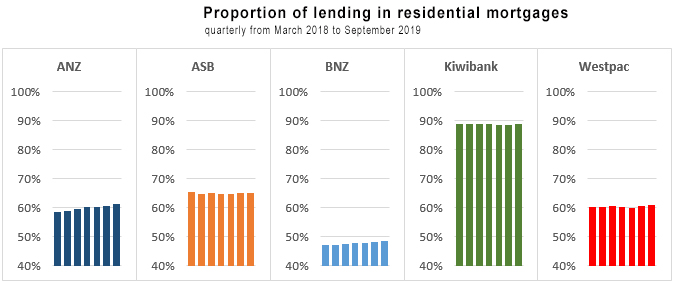
In the end, depositors can't make specific sector exposure choices by parking their funds at a retail bank. But they can do so with their eyes open.
Every investment carries risk. It is up to you how you assess that, including where you bank your funds.
Here is the link to the RBNZ Dashboard from where the data for this article was sourced. Here is a link to our tool as an alternative way to compare that data.
And for the record, here is the combined cash plus shareholder backing for five smaller retail banks in New Zealand. (Be careful of the scale because it is different to what has been used above.)
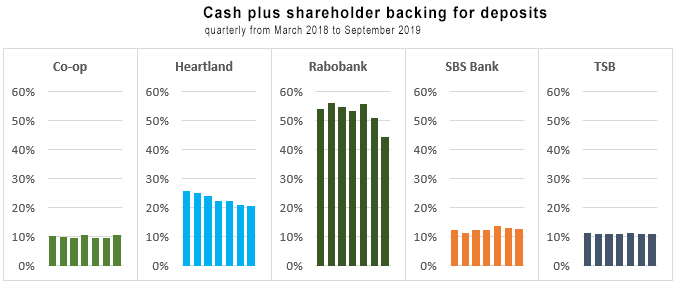
(Rabobank NZ isn't strictly comparable in this simplified way, so you should investigate those differences. But it does have interesting variations.)
We welcome your comments below. If you are not already registered, please register to comment
Remember we welcome robust, respectful and insightful debate. We don't welcome abusive or defamatory comments and will de-register those repeatedly making such comments. Our current comment policy is here.