

Big numbers of owner-occupier new borrowers are opting to go for floating rates, the latest Reserve Bank monthly figures show.
For those opting to fix, there's been a huge surge to the one-year terms.
The RBNZ's C71 data series, which was introduced only fairly recently and has data going back to 2021, differs from other monthly series in that it shows mortgage figures for after the mortgage has been uplifted (while other series highlight mortgage figures for when the mortgage has been committed to). (The RBNZ summary of the latest data is here.)
The C71 data therefore shows the flow of the money and into what rates as and when it happens.
And the latest figures, for October, shine the spotlight on a new trend that was also visible in the recently released S33 data for October that highlighted the total mortgage stock by times to next repricing.
The data is showing that there's a new-found popularity for floating mortgages.
According to the C71 data showing new mortgages taken out in October, some 27% (nearly $1.5 billion) of the $5.335 billion for owner-occupiers was in floating.
That was a very sharp rise up from just 20.3% in September and the 27% figure is the second highest percentage for floating since the start of the data in April 2021 and it was only bettered by the March 2022 figure of nearly 28%.
Since pretty much the start of this year borrowers have been going shorter and shorter with their terms in anticipation of Official Cash Rate (OCR) cuts from the RBNZ - which subsequently began in August.
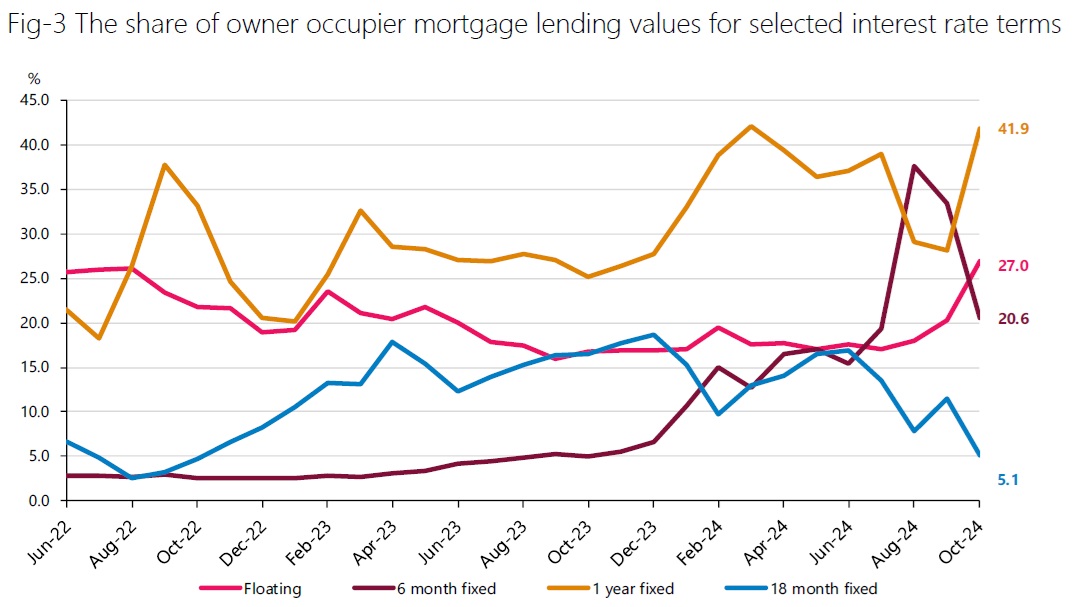
This trend among the borrowers has seen the previously unfashionable six-month term rise to prominence, peaking at a 37.6% share of new owner-occupier mortgage money in August. The share fell to 33.4% in September and then to 20.6% in October.
As the six-month term has declined in popularity, then so the more traditionally-favoured one-year term has stormed back to prominence. In October the one-year term took 41.9% of the owner-occupier mortgage money share, up from 28.2% in September.
The $2.234 billion worth of owner-occupier mortgage money put on one-year terms in October was the highest monthly tally for this term since July 2021.
Some 89.4% of the owner-occupier new mortgage money in October was either floating or for a one-year or shorter fixed term duration.
At times the two-year terms have been the most popular but they are currently right out of favour. Just 3.5% of the owner-occupier mortgage money was put on a two-year term in October. In October 2023 some 24.3% of the mortgage money was on two-year terms.
The trends are very much the same for the investors.
In October 29.3% of investor new mortgage money was floating, while 44.6% was fixed for one year.
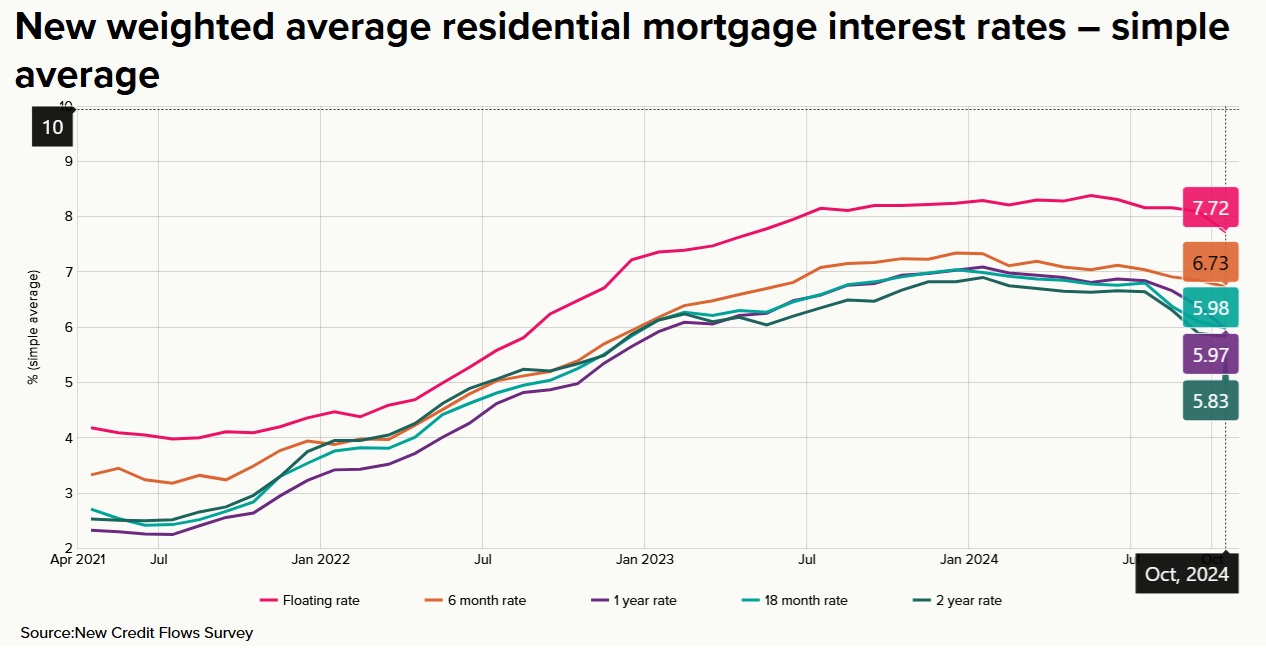
Separately, a new RBNZ monthly data series highlights the actual weighted averages charged by the banks on new lending. The RBNZ says the purpose of this data collection "is to better understand the provision and pricing of credit in the economy".
The data shows that the biggest drop in October was on one year rates, with a 41 basis-point fall to 5.97%. Not far behind were the floating rates, with a 37 bps fall. But the average rate on floating, at 7.72% was still much higher than the fixed rates.
We welcome your comments below. If you are not already registered, please register to comment
Remember we welcome robust, respectful and insightful debate. We don't welcome abusive or defamatory comments and will de-register those repeatedly making such comments. Our current comment policy is here.