

Well, they certainly haven’t been knocking down the front door of the houses to get in. That’s true.
But the investors are definitely having a quiet look again at the side entrance.
Yes, investors are back in the housing market with renewed interest and involvement.
Now, I will preface everything I'm about to say by remarking first up that all the narrative at the moment appears to be about investors getting out rather than in.
I would say it's possible for BOTH things to be true at the same time. It could be that there were those who climbed in during the pandemic panic of 2020-21 and subsequently found themselves in an unsuitable position as mortgage interest rates rose. And this may still be the case for some even though rates are now going down - though probably not to the sorts of levels prior to the pandemic.
But then there's likely others who sat on the sidelines and now see opportunities. And while everybody else moans and complains about the state of the market, they are quietly moving.
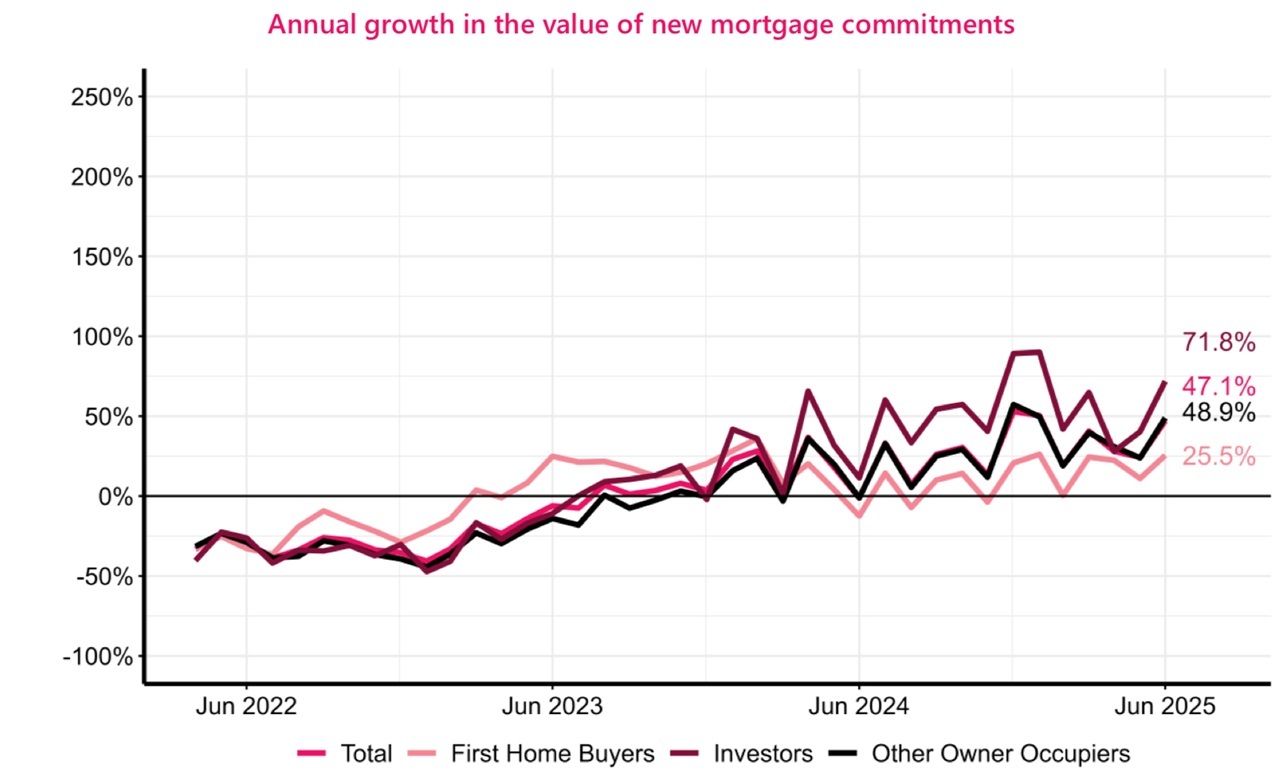
Look, that's only a point of view, but here comes a look at the mortgage figures for the first half of this year - up to the end of June. And I highlight the investors.
In the first six months of this year (note: all the figures here relate to mortgages with registered banks) the pile of investor mortgage money grew by $3.247 billion - to a grand total of $96.719 billion of investor mortgages outstanding. That growth is the most for the first half of a year since the $4.866 billion surge in the investor mortgage pile seen in the first six months of 2021. (See also, RBNZ summary.)
The below table shows the growth in the total mortgage pile, and also highlights the growth in the investor mortgage stock, for the first six months of each year from 2017 to this year.
| Growth in outstanding mortgage pile, first six months of years 2017-2025 | |||||||||
|---|---|---|---|---|---|---|---|---|---|
| 2025 | 2024 | 2023 | 2022 | 2021 | 2020 | 2019 | 2018 | 2017 | |
| Total | $10.014b | $5.971b | $4.973b | $7.598b | $17.299b | $6.8b | $8.266b | $7.382b | $6.91b |
| Investor | $3.247b | $0.902b | $0.147b | $1.002b | $4.866b | $2.093b | $1.219b | $0.926b | $1.196b |
The RBNZ’s data series breaking down this specific information goes back only as far as 2017, but we can surmise that the increase in total level of investor borrowing in the first half of 2016 (when the investors were really going for it) would have been likely bigger than the 2021 surge.
Therefore, we can probably say with confidence that the first six months of this year, in terms of growth of mortgage stock, has been the third biggest for the investors in the past 10 years.
As I said in an earlier article, for all that the talk is about how ‘quiet’ the housing market is - really that’s just about the fact that prices are flat (or maybe even falling again, a bit).
However, the mortgage figures tell us that there’s a reasonable level of activity in the market. Prices aren’t rising because of the sheer volume of properties on the market. But a reasonable number of the properties are selling and mortgage business is brisk - very much back to ‘normal’ levels after the weirdness of the pandemic period.
For investors it’s a bit hard to judge what ‘normal’ is, since over the last 10 years and more the pattern for investor involvement has tended to be either gorging themselves sick, or periods of self-denial.
It’s interesting to reflect on what an impact the Reserve Bank’s loan to value ratio (LVR) limits have had on investor involvement.
The LVRs were originally launched in 2013 and in their first iteration made no distinction between borrower groups in terms of limits. The RBNZ subsequently conceded that this first iteration of the LVRs had a disproportionate impact on the first home buyers. A lot of FHBs were ‘locked out’ of the market at that time - and the investors were key beneficiaries of this.
As noted above, we don’t have a break down of the investors’ mortgage pile prior to 2017. However, after introduction of the LVRs the RBNZ in 2014 started publishing monthly totals of new mortgage commitments made each month - and this included a monthly investor breakdown.
And we can see that in the first six months of 2016, investors borrowed $12.107 billion out of a total of $36.449 billion. So investors borrowed a third of the total mortgage money advanced at that time. A THIRD.
FHBs in the same period borrowed $4.163 billion (just under 11.5% of the total).
In what appeared not much more than exasperation at the time, in the middle of 2016 the RBNZ slammed a 40% deposit rule on investors. I didn’t think it would work.
It did. For the first six months of 2017 investors borrowed just $7.156 billion in new mortgages. And, generally, they’ve been subdued since.
Apart from the pandemic.
And what happened then? Well, the RBNZ removed the LVR limits entirely as from May 1, 2020.
In the second half of 2020 the investors borrowed $11.086 billion. Fill your boots is, I believe, the expression. In the last six months of 2020 the investors’ pile of outstanding mortgages grew by $5.28 billion. And the RBNZ began moves to reintroduce the LVRs.
But the ball kept rolling, for a while, and in the first half of 2021 the investors borrowed $10.37 billion and grew their mortgage pile by that $4.866 billion tally we mentioned further up the article.
After that, all quiet.
Now, however, things are moving again and it comes interestingly with the LVRs in place (although the deposit limit for investors now is 30%), but crucially also with debt to income ratios (DTIs) in place.
So, looking at the first six months of the year, the investors borrowed a total of $9.287 billion, which in terms of activity compares reasonably well with that $10.37 billion in the first half of 2021.
However, as we’ve noted separately, it’s difficult to tell what ‘new’ mortgage money is actually going for buying a house and what might be for a top-up or more particularly in the current environment, for changing loan provider. We know that in June of the $8.261 borrowed, some $2.475 billion (30%) was for change of loan provider. We don’t know how much of that amount was investors changing providers, but some must have been.
So, the growth in the total mortgage pile is more helpful for us here.
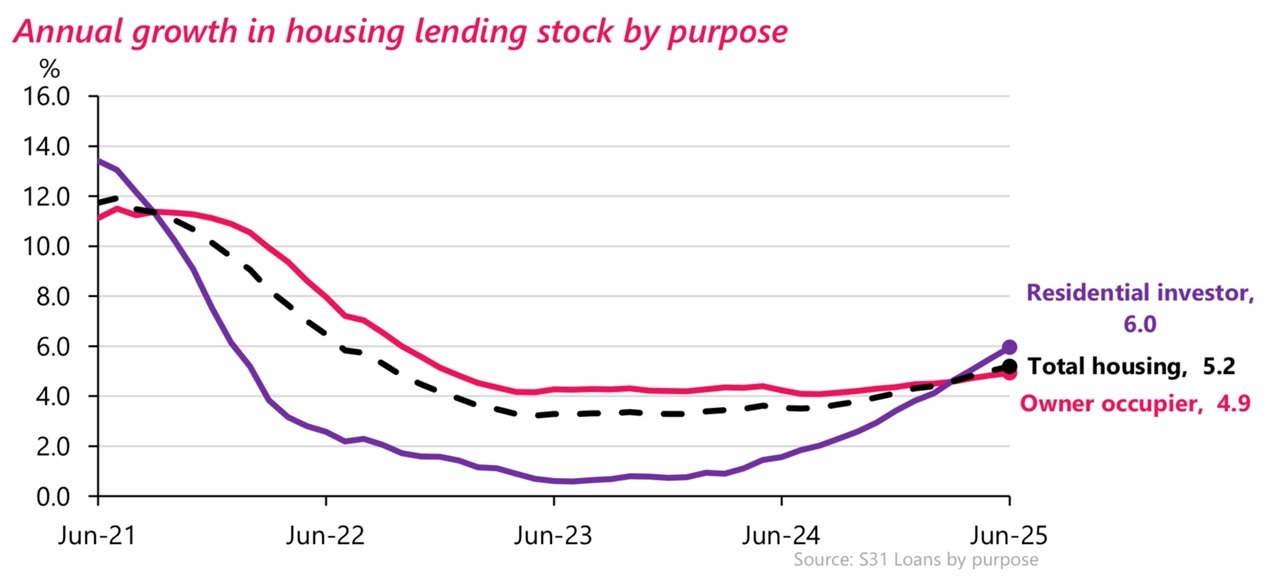
Well, as mentioned above, the investors grew their mortgage pile by $3.247 billion in the first six months of 2025, easily the most since the first half of 2021 - and we have to go back to 2016 to see another larger amount.
In terms of the total outstanding mortgage pile - all mortgages - that stood at $374.113 billion as of the end of June. The growth in the mortgage pile in the first half of this year was $10.014 billion. The biggest growth in the first half of a year was, no surprises, in 2021, when the pile grew by $17.299 billion.
But believe it or not, the $10.014 billion growth in the first half of this year is the second highest ever for the first six months of a year. And, yes, I know houses cost a lot more so mortgages got bigger - but that’s the reality, the first six months of 2025 has seen the second most growth ever in the amount of the mortgage pile.
The investors have certainly played their part in this growth. The $3.247 billion of growth in the investor mortgage loan book represents 32.4% of the $10.014 billion growth in the whole mortgage pile in the first six months of 2025. And that’s actually the highest percentage investors have had of the growth in the total mortgage pile in the first half of a year since 2017 when the data series that does contain the investor breakdown was commenced.
Can we make any conclusions about investor share of property buying per se?
Well, not without stretching things a little.
We do know that in the first six months of this year $26.325 billion of mortgages were taken out specifically to buy a house.
If we take the over $8.527 billion of first home buyer borrowing in the first half of the year and put it against the over $26 billion worth of mortgages specifically for house purchases, it indicates the FHBs are borrowing just under a third of all the money being advanced for house purchases.
We know that investors borrowed in total $9.287 billion in the first half of this year. We do not know how much of this might have been for changing loan providers, or top ups. We do know that the investor mortgage pile grew by $3.247 billion - so, the assumption would be that amount at least was spent on buying property. It might not be wild to assume maybe $4.5 billion worth of mortgages was borrowed by investors in the first six months of this year for buying property. So that would mean about 17%, or roughly a sixth of the total amount borrowed in the first half of this year was by investors to buy property.
They are back. Quietly.
4 Comments
So...is "buy now" a depressed price point with capital gain in your future, cos cant see buy now makes sense from a yield perspective. Pretty big dice role.
The role of the dice is to roll. lol.
Yes, investors are back in the housing market with renewed interest and involvement.
Why ???
Low ball offers make yields workable
secret of real estate Price Fixes Everything
back and involved does not mean paying ask, investors are like sharks and will circle an easy kill
the agents actually need these "wasting everyone's time" offers to wake up the vendors thinking their shitbox or bare land is still worth 40% over current valuation
We welcome your comments below. If you are not already registered, please register to comment
Remember we welcome robust, respectful and insightful debate. We don't welcome abusive or defamatory comments and will de-register those repeatedly making such comments. Our current comment policy is here.